
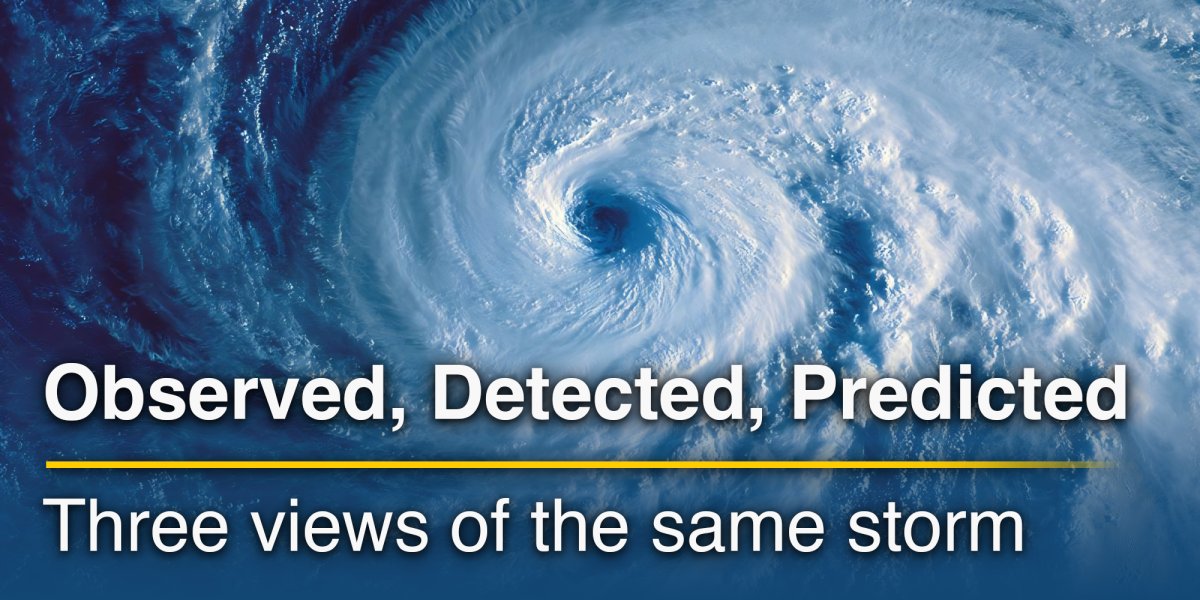
A storm can appear as a broad white cloud shield on satellite imagery, a broken chain of coloured cells on radar and a smoother oval of rainfall on a forecast map. Viewed side by side, the pictures may seem contradictory. The satellite suggests a large system, the radar shows rain in only part of it, and the model places the strongest precipitation somewhere else.
The apparent disagreement begins with a simple point: these maps do not show the same thing.
A storm is not a single object. It is a three-dimensional, evolving combination of clouds, water droplets, ice particles, vertical motion, wind, temperature and moisture. Satellite instruments observe radiation leaving the top of the atmosphere. Weather radar detects particles within its beam. A numerical model calculates how the atmospheric state may evolve according to physical equations.
Each map isolates a different part of the storm. Used alone, every view has limitations. Read together, they provide a much fuller account of what is happening and what may happen next.
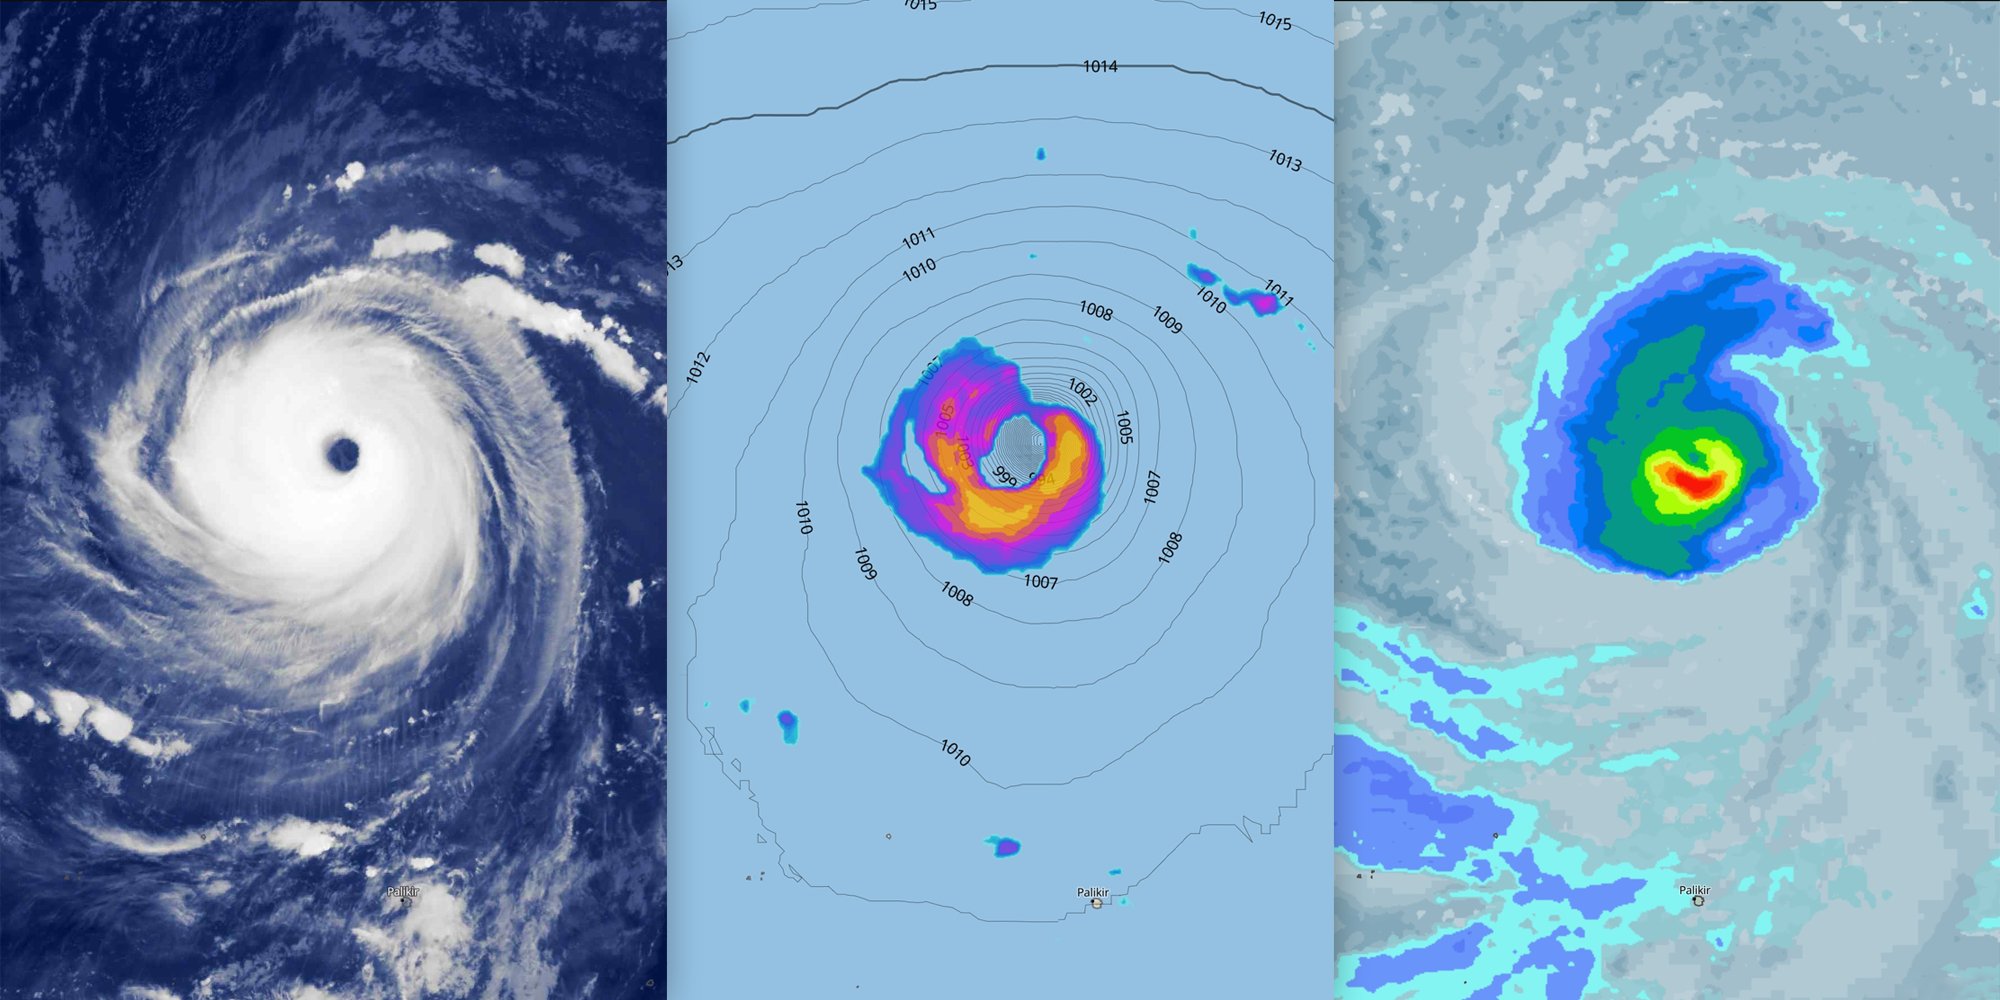
Satellite imagery: the storm seen from above
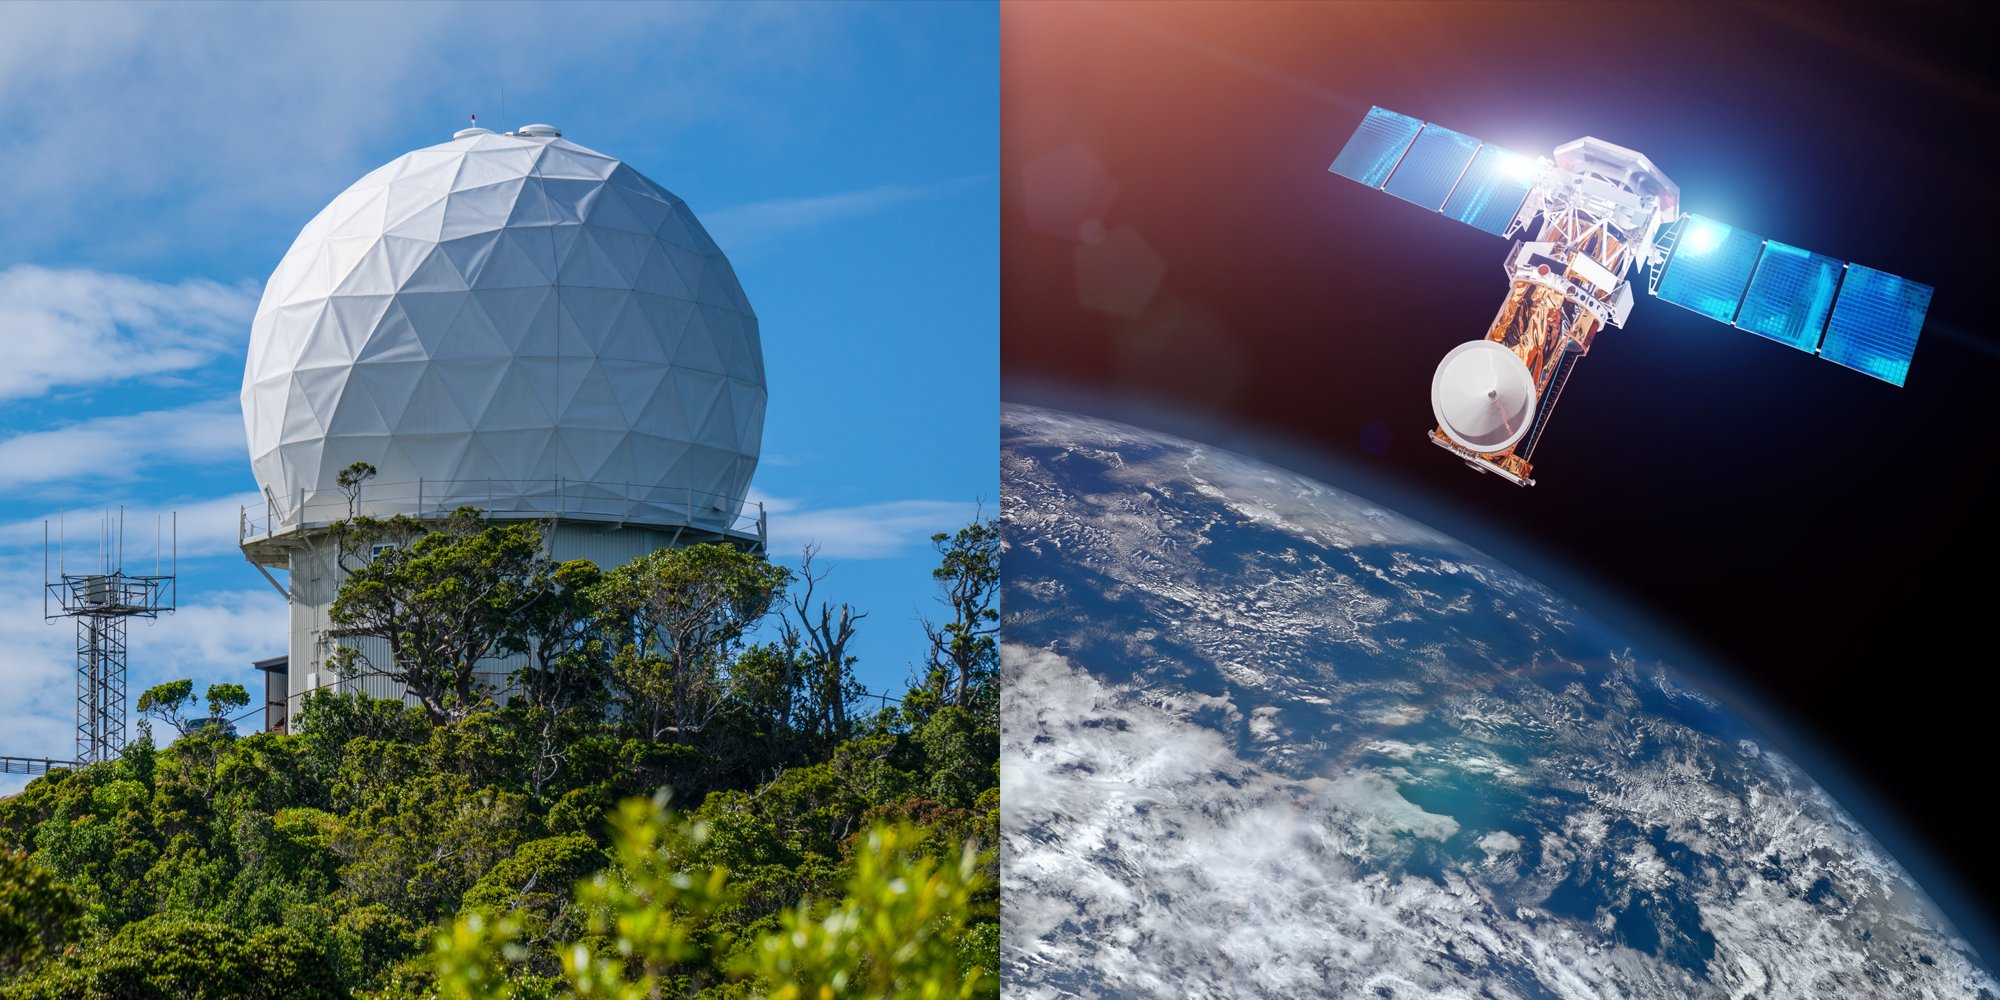
Weather satellites offer the broadest view. Geostationary satellites remain above the same part of the Earth and repeatedly scan large regions, allowing cloud systems to be followed as they form, expand and rotate.
What appears on the image depends on the satellite channel.
During daylight, visible imagery records sunlight reflected by clouds and the surface. Thick clouds usually appear brighter because they reflect more light. At night, visible imagery is unavailable, so meteorologists commonly use infrared channels. These measure thermal radiation and allow cloud-top temperature to be estimated. Very cold tops often indicate clouds reaching high into the troposphere, such as deep cumulonimbus towers or the extensive anvils produced by thunderstorms. Water-vapour imagery highlights moisture patterns and atmospheric motion at different levels, including dry intrusions and upper-level circulation around troughs and low-pressure systems.
Satellite products also have their own ambiguities. Thin cirrus may partially hide lower clouds. Snow-covered ground can resemble cloud in some visible channels. Small low clouds, fog and aerosols may be difficult to identify, depending on the channel, illumination and processing method.
The major strength of satellite imagery is context. It reveals the overall cloud architecture of a cyclone, the growth of a convective complex, the moisture stream feeding a frontal system and developments over oceans or remote regions where radar coverage is limited.
Radar: detecting precipitation inside the storm
Weather radar works very differently. It sends pulses of electromagnetic energy into the atmosphere and listens for the small fraction scattered back by objects in the beam. Raindrops, snowflakes, hailstones, insects, birds and even non-meteorological targets can produce returns. The strength of the returned radar signal is expressed as reflectivity, usually in units of dBZ (decibels of Z).
High reflectivity often indicates a large concentration of hydrometeors, larger particles or both. Yet the relationship between reflectivity and rainfall is not fixed. Large raindrops, wet snow and hail scatter radar energy differently. A bright radar echo may represent intense rain, but it may also be enhanced by hail or by melting snowflakes near the freezing level. Dual-polarisation radar
adds information about particle shape and consistency, helping meteorologists distinguish rain, snow, hail and mixed precipitation more reliably.
Radar maps often look more detailed and fragmented than satellite images. A broad cloud shield may contain only a few narrow precipitation bands. Within a thunderstorm complex, radar can reveal individual convective cores, bowing lines, rotating structures and areas of stratiform rain that are hidden beneath the cloud canopy when viewed from space.
Even radar is not a direct photograph of rain at street level. The beam travels upward at a slight angle and rises farther above the surface with distance. Close to the instrument, radar can sample the lower atmosphere in considerable detail; far away, it may be observing several kilometres above the ground. Shallow rain or snow can pass underneath the beam and remain undetected. Mountains may block part of the signal, while very heavy precipitation can weaken the beam and obscure what lies behind it.
Some echoes do not reach the surface. Rain or snow may evaporate while falling through dry air, producing virga. The World Meteorological Organization defines virga as precipitation trails attached to a cloud base that do not reach the ground.
Other false echoes can create the opposite impression. Buildings, terrain, birds or unusual atmospheric refraction can generate signals that look like precipitation. Melting snow can produce a “bright band”, an area of enhanced reflectivity that exaggerates rainfall estimates. Radar composites apply filtering and quality control, but no processing system removes every error.
Radar’s great advantage is immediacy. Within the covered area, it shows where precipitation particles are present, how the echoes are moving and where cells are intensifying or weakening. That makes it central to short-term monitoring and nowcasting.
Model maps: a calculated future, not an observation
A forecast model map belongs to another category entirely. It is not an image recorded by an instrument. It is a calculation.
A numerical weather model begins with an analysed atmospheric state and solves equations describing motion, heat, moisture and other physical processes. The model estimates the evolution of pressure systems, fronts, clouds and precipitation over the next hours or days. The resulting map may resemble radar, but the similarity is visual, not observational.
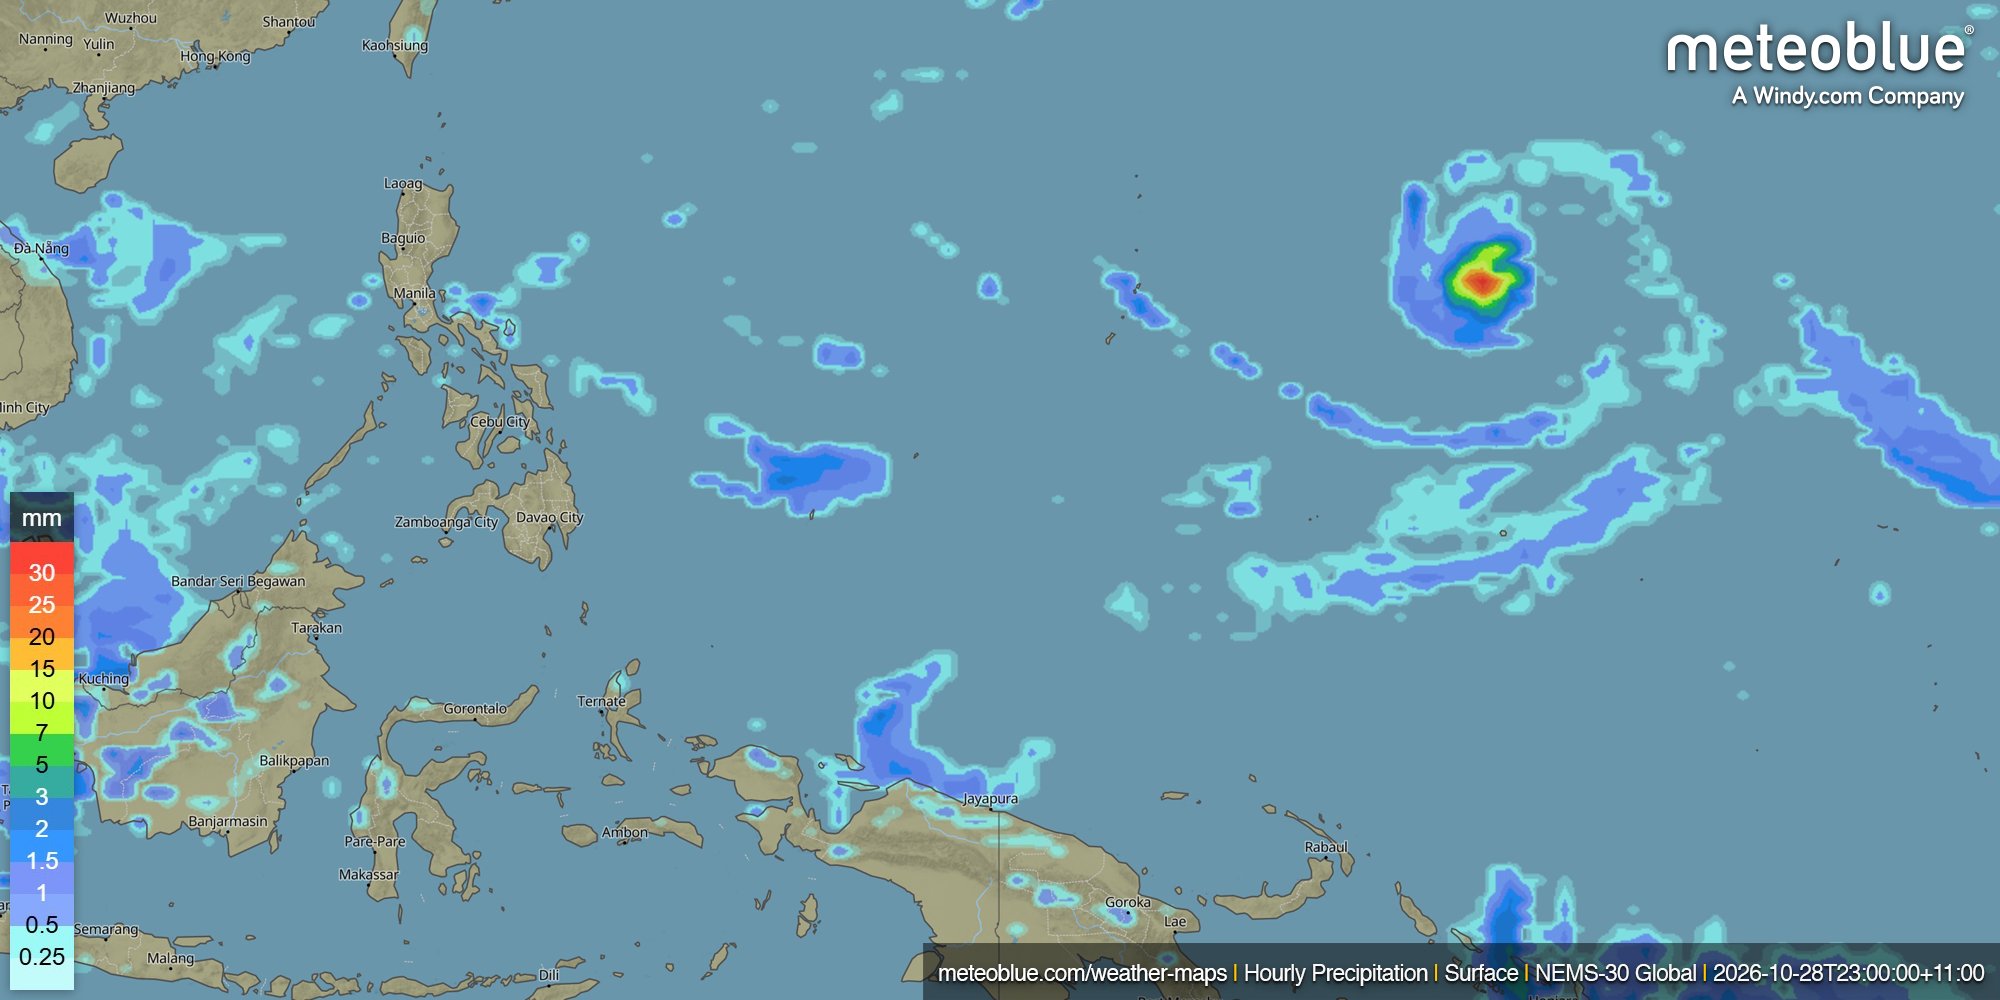
The distinction becomes especially important with precipitation. A radar layer may represent reflectivity near a particular scan time. A model map may display precipitation accumulated during the previous hour, the following three hours or an entire day. On meteoblue Weather Maps, hourly, daily and accumulated precipitation are separate layers, each describing a different time interval. Comparing them without checking the valid period can create an apparent disagreement that is simply a difference in definition.
Models also work with grid cells. A value represents an area, not an exact point. Processes smaller than the grid spacing must be simplified or parameterised, although high-resolution models can explicitly represent more convective structure than coarser global systems. The resulting rainfall field is usually smoother than radar, particularly when maps show hourly or daily totals.
Thunderstorms pose a special problem. The model may forecast the correct atmospheric environment, the correct time window and a realistic storm system, yet place the heaviest rain 20 or 30 kilometres away. At one location, the forecast then appears completely wrong. At the scale of the whole storm, it may have captured much of the event.
That’s why a model map is best read as a physically calculated scenario. It estimates where precipitation should develop, how long it may last and how the system may move. It should not be expected to reproduce the exact texture of a radar image several hours in advance.
Why the maps disagree even when their timestamps match
The same displayed time does not always mean the maps describe the same period. A satellite timestamp usually marks the scan time, radar may combine several recent scans, and a model’s “15:00 precipitation” can refer to accumulation over the previous hour. Daily precipitation combines a much longer period.
The products also represent different atmospheric levels and variables. Infrared satellite imagery mainly reflects conditions at cloud top, radar detects precipitation particles along its beam at different heights, and model precipitation maps estimate how much precipitation reaches the surface over a defined period. So even when the timestamp matches, the maps are not describing exactly the same information.
Resolution also differs. Satellite pixels, radar bins and model grid cells have different sizes, so small features may disappear or appear smoother on one map than another.
Colour scales can also be misleading. Red on radar usually represents strong reflectivity, while red on a forecast map may represent a high precipitation total. Similar colours do not necessarily show the same quantity.
Following a storm through its development
To put these differences into context, take the example of a convective system developing over the sea and moving toward land.
At first, satellite imagery may provide the clearest sign of development as clouds grow, cloud tops cool and an anvil forms. Radar may still show little if the storm is outside the network or precipitation has not developed strongly enough. The model indicates whether the surrounding conditions favour further development, although the storm may form in a slightly different location.
As the system matures, radar gives the clearest view of current precipitation, including the strongest cores and movement of rain bands. Satellite imagery shows the broader cloud structure, while the model provides the expected track and duration.
During decay, radar echoes can weaken quickly as precipitation ends, while the satellite cloud shield may remain visible for much longer. This can make the storm appear more active on satellite than it actually is at the surface.
All three maps can still be accurate at the same time.
Reading the layers together in meteoblue
meteoblue Weather Maps place observed and modelled weather layers within one mapping environment. Satellite imagery shows current clouds and weather systems, while live radar composites depict precipitation intensity and movement. In addition, meteoblue Maps API includes minute-by-minute radar animation and a radar-based nowcast extending up to two hours.
Forecast precipitation layers add the next part of the story. Hourly Precipitation Maps show modelled precipitation for shorter time intervals, Daily Precipitation Maps summarise the total over a full day, and Accumulated Precipitation Maps combine precipitation over a selected period. Additional layers for pressure, wind and clouds help provide context for the atmospheric conditions associated with the precipitation.
For a selected location, rainNOW provides short-range precipitation information in 15-minute steps, using remote-sensing observations such as radar and satellite data. rainSPOT gives a compact view of forecast precipitation around a location, with the selected place positioned near the centre of the model grid. These products answer a more local question than a continental weather map.
The meteoblue Learning MultiModel (mLM) has a separate role. It does not replace radar or satellite imagery. It evaluates and combines forecasts from many numerical models for a particular location, while downscaling adjusts the result for local terrain and land cover. Nowcasting then incorporates the newest radar, satellite and station observations for the immediate hours ahead.
The result is not one universal map declared “correct”. It is a forecast chain in which observations describe the current storm, models calculate possible developments and post-processing refines the local prediction.
A practical way to read a storm
Begin with the satellite image to identify the size, structure and movement of the cloud system. Depending on the type of satellite imagery, you can look for different features: visible imagery shows cloud extent and texture, infrared imagery highlights cloud-top temperatures, and water vapour imagery reveals moisture patterns and dry-air intrusions. Features such as cooling cloud tops, expanding cloud shields, frontal bands and moisture streams can help show how the system is developing.
Then check radar to see where precipitation particles are actually being detected. Watch the animation, not only a single frame. Movement and persistence often reveal more than colour intensity alone.
Next, open the model precipitation forecast. Check whether the layer shows an instantaneous rate, an hourly total or a longer accumulation. Compare several forecast times and, where available, several models. Comparing the forecast with radar observations helps show how well the model represents the location, intensity and movement of the precipitation.
Finally, examine surface observations and the local forecast. Weather stations, rain gauges and reports help establish what is reaching the ground. Radar and satellite are remote measurements; the model is a simulation. None should be treated as perfect ground truth in isolation.

One storm, different views
Satellite, radar and model maps show different parts of the same weather system. Comparing them helps reveal differences in cloud structure, precipitation and forecast development.
Check what each map shows, which atmospheric level or time period it represents, and whether the information is observed or forecast. Together, the three views provide a more complete picture of the storm.
Have you noticed interesting differences between satellite, radar and model maps? Share your observations or questions in the meteoblue Community Forum.


