Does weather influence Corona Virus?

To contribute to the Coronavirus (COVID-19) risk assessment, meteoblue provides the first global study on relationship between Corona-Virus infections and weather conditions.

We selected 21 countries from 5 continents and all global climate zones, with a total of 103'814 cases of diagnosed Coronavirus (COVID-19) detection (infections), and analysed the correlation of new infections with 6 major weather variables (air temperature , relative humidity, radiation, wind speed, sunshine hours and precipitation) during the period from 01.January to 18.March 2020, using our hourly history+ data, which can be readily downloaded for any place on Earth.

The study produced no visible correlations for any of the variables, neither in 21 countries from 5 continents and all global climate zones, nor within the 7 countries with most detections in March (China, Italy, Spain, France, Germany, Switzerland, Iran).

Although this study is preliminary, some important conclusions seem possible:

  • Higher air temperatures are unlikely to slow the spread of the virus significantly.
  • The COVID-19 infections seem to be largely independent of external weather influence.
  • Further analysis should focus on the effect of temperature, relative humidity and radiation, by reducing masking factors such as behaviours changes (public restrictions, hygiene measures, others), location differences and reporting imprecision.

As a general summary, we conclude that containment of COVID-19 infections can not rely on weather as a significant factor in helping reduce the spread of the disease. The detailed study is available for download here.

We will continue investigations into more detailed relations, and appreciate any contributions and suggestions.

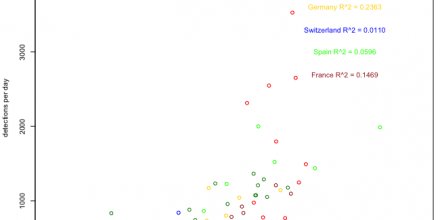
20200322000848_CORONAdetection-temperature-7days-Land07-20200101-20200318-logo_440x220.jpg

20200322000719_CORONAdetection-temp-Land08-20200101-20200318-logo_440x220.jpg

20200322000636_CORONAdetection-temperature-Land21-20200101-20200318-logo_440x220.jpg

Comments

Posted on 2020-03-22 17:39:47 by nikolamilevski

Thank you very much meteoblue!

Posted on 2020-03-23 13:38:00 by pbiel

Nice! Thanks for sharing. However, two remarks:
First, I personally find it difficult to trust an analysis that does not show any correlation. In such a case, it could also be that your tools/data are simply corrupted. Do you think it would be possible to re-run the same analysis with data e.g. from influenza? Just that we see how a correlation (the flu is known to correlate with temperature and radiation at least) looks like? That would be awesome!
Secondly, I suggest you add a factor for the time between a patient being infected and the report of his infection. Probably, you'd rather find a correlation between infected people and the weather ten days (or so) ago …?

Posted on 2020-03-23 20:10:08 by KGG (meteoblue)

Thanks very much for your comments.
1. no correlation is not an impossibility: it happens, as it seems in this case. We all are used to correlations, because we look for them, and ignore the cases without (because they do not allow us to influence outcomes). This was exactly the question here: can weather influence Corona infections - and it seems less so. Anyway, we will take up the suggestions on influenza, as well as aiming at more regional detail.
2. time from infection to report: we are looking into this as a next step.
Thanks for the contributions!

Posted on 2020-03-24 07:58:37 by ivan.genchev@@?;:=+?%.com

Thanks for the interesting data. I believe number of new affected people as function of T is a key study.

I would suggest to make it per country. To minimize bias from quality of medical service in different countries and cultural dependencies. Some countries measures 100 probes per day, another 10000. I expect T dependence to be not that strong as the time period of measurement: in the beginning of pandemia or at the end. I believe it will be more correct to present T as "third" dimension on the graph: number of new infected people as function of day of pandemia in the current country. Temperature could be presented as color of point(0-5 C: blue, 5-10 C: green, 10-15 C: yellow, 15-20 C : red). And that shown per every country.

Cheers,
I.


Posted on 2020-03-26 19:34:15 by tremblay.ly@>^+>^>&:.com

I would also suggest to make separate analysis by country (in this case sociological aspects, public restrictions, hygiene levels can be assumed to be fairly similar across the board). Also, the fact that you only used one city in each country appears to be a pretty big bias, especially in countries with diverse climates (Italy and France come to mind for instance). A study looking at cases in China recently came out (https://papers.ssrn.com/sol3/papers.cfm?abstract_id=3551767) correlating (although with a week correlation...) covid19 cases with temperature and humidity. Maybe something to check out?

Write comment

You need a meteoblue account to comment on articles
Back to top