Climate change generally causes our atmosphere to warm up, which can also be analysed with our climate change diagrams visualising changes in temperature and precipitation. Considering these diagrams, it is unsurprising that this year’s winter temperatures in the Northern hemisphere were above the long-term average. Moreover, the weather during this winter was accompanied by several weather extremes and contrasted within the northern hemisphere, from mild and warm periods to great winter storms.
This article summarises meteorological highlights of this year's winter and explains its driving factors and influences.
Entering its 3rd year, a global weather pattern called La Niña, the cold phase of the so-called ENSO (El Niño Southern Oscillation) developing over the equatorial Pacific Ocean, showed the increased influence of the weather in the northern hemisphere. While it impacts tropical rainfall, pressure patterns and the ocean-atmospheric feedback system, its influence spreads globally. These influences were increasingly observed this winter, especially in North America.

Historically, during La Niña, a solid blocking high-pressure system develops over the North Pacific, redirecting the polar jet stream to the northern United States. Low-pressure systems over Canada and North America lead to cold anomalies in the western United States and warmer and mild winter conditions in the South and Northeast. The map shows the temperature anomaly for February. It analysis this year’s February temperature data with the long-term average since 1979.

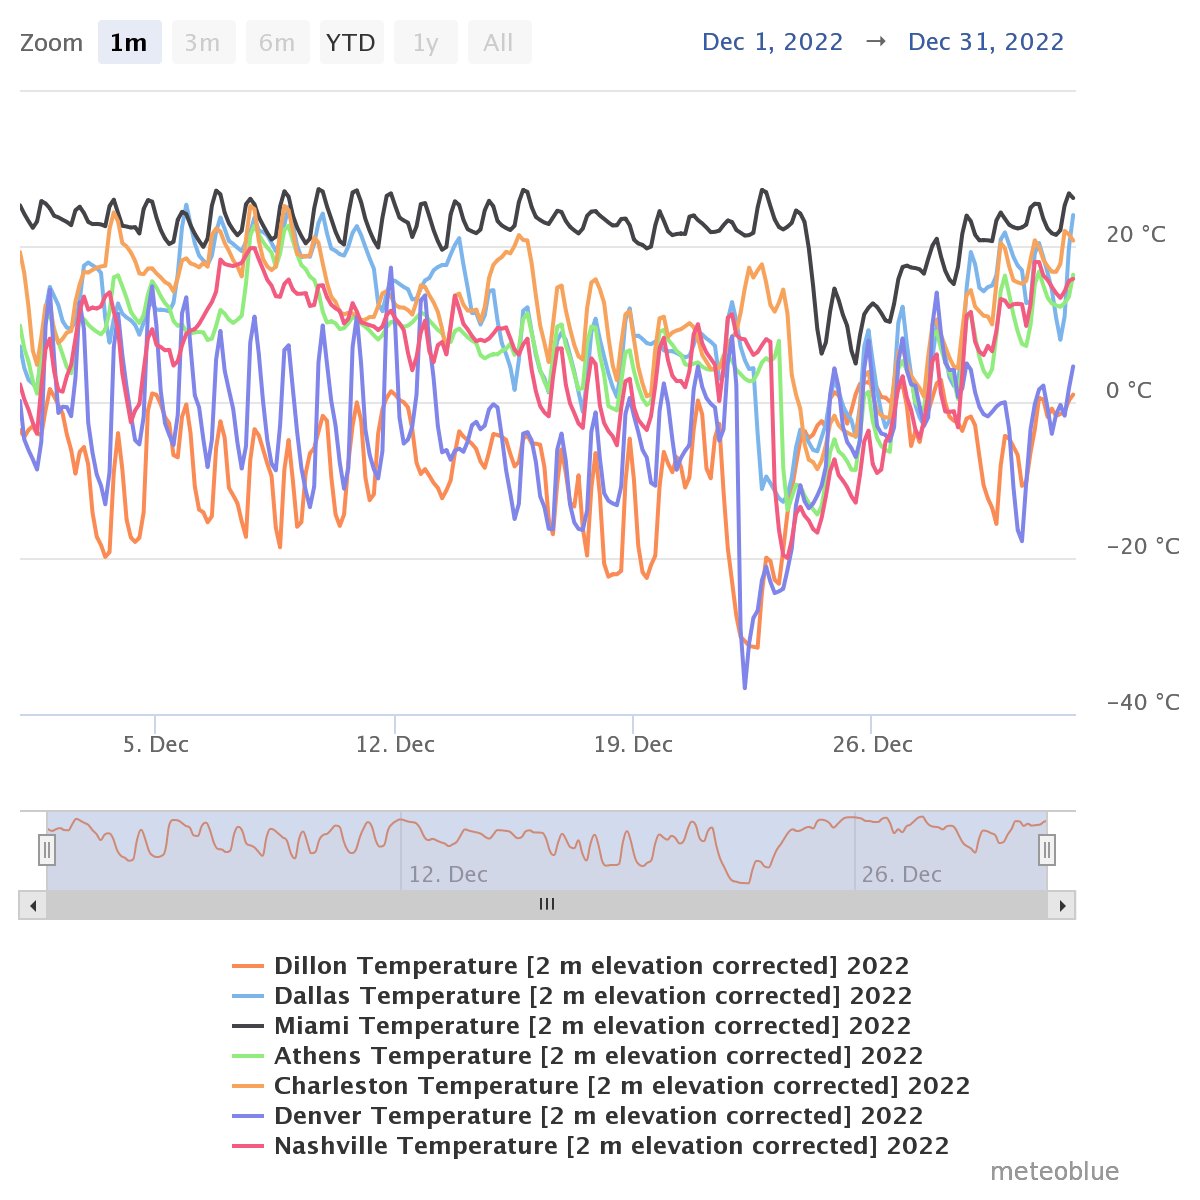
Over the Christmas holidays, a historic arctic outbreak caused the winter storm "Elliot" to drive into Canada and the United States. In several cities throughout most of the U.S., like Dillon, Charleston and even Dallas, Nashville and Miami, the temperature dropped quickly within a few hours, as the minimum temperature map for 2023-12-24 shows.
Furthermore, as shown in the left screenshot, we have used our history+ interface to compare temperatures in 7 US cities. There, the temperature drop is also clearly visible.

We have further investigated the temperatures for Denver from December 21st to 22nd (right screenshot). The history+ year comparison considers previous years, and the graph shows last year’s temperatures as a light blue line. The temperature drop caused by winter storm Eliot led to the coldest temperatures observed, which can be seen when comparing temperatures since 1984.
The winter in North America was not only accompanied by many storms in December like the one previously described, but extremes continued in February. While winterly conditions were in the usually mild California, a high-pressure system over the Atlantic, lying southeast of the USA, formed springlike weather in the southern states. As a result, temperature differences were unusually high across the US, as seen on the temperature anomaly map for February 2022. Also, solid and cold winds blowing inland from the northeast coast caused severe conditions in the US Lakes Region, ranging from heavy to freezing rain and snow. That caused the winter to be colder or warmer than average, depending on the location.

One example of unusual positive temperature anomalies is Pittsburgh in the Eastern US. There, from January to February, unusually warm temperatures with significantly high precipitation amounts during January were reported.
Furthermore, it is interesting to mention the polar circulation in the atmosphere. In Autumn, temperatures in the polar regions drop, creating a significant temperature difference between the polar and subtropical regions, forming a large low-pressure cyclonic band in the northern hemisphere, keeping the cold air within the polar region. However, in some years and under specific conditions, this band can be less stable, causing the cold air to “break out” and drift more towards the south, moving towards the United States, Europe, and Asia. This phenomenon is likely to have been a primary driver of this year’s winter (storms), which we have covered in one of our February weather news.
The circulation across the northern hemisphere introduced a sharp contrast, especially between North America and Europe. The Alps are an excellent example of how fluctuating the winter weather was in Europe.

In Europe, arctic air masses pushed from the north brought freezing temperatures and some snow in the Alps at the beginning of December, as shown in the screenshot of our history+ data downloading interface. The chart reveals this winter's temperature and snow amount patterns by looking at different locations in the Alps, like Zillertal or Heiligenblut in Austria and Appenzell or Zermatt in Switzerland.
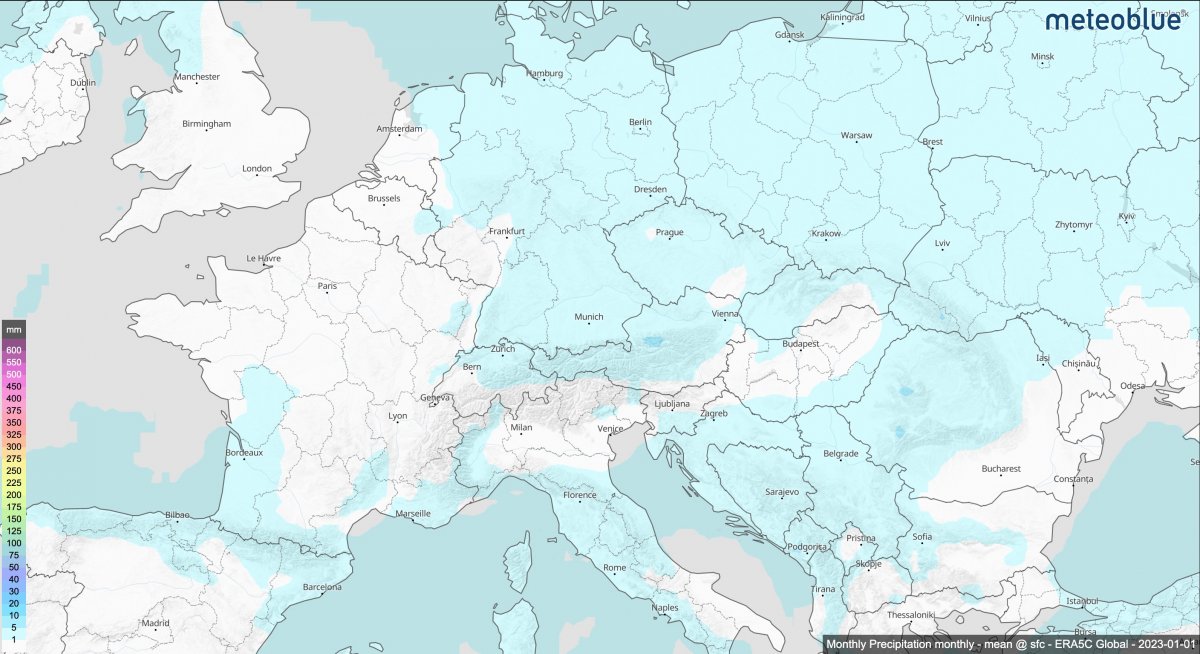
After a wintery start, a high-pressure system dominated most of Europe from mid-December until the first week of January, causing very mild weather during New Year’s Eve. In the alps, temperatures rose to 15 degrees Celsius, which caused the snow sports season to slow down significantly. After receiving some snow during mid-January, a cold and stormy front hit the mountains bringing lots of snow and high winds a few days after, causing snow chaos in some parts of the Alps. Afterwards, perfect skiing conditions were met with fresh snow and clear and sunny days but relatively warm temperatures. Since then, conditions have been relatively stable with cold temperatures, but the precipitation sums were extremely low, as our monthly precipitation map for February visualises.

In summary, it has been a warm winter with less precipitation in the Alps than on average. The Climate Comparison shows that quite clearly for Ischgl, Austria.
Throughout the rest of Europe, the weather was rather grey and cold, not very wintery, but in some places, wet in January and February. Countries like Latvia and Estonia experienced above-average precipitation amounts.
This winter, in summary, we observed variable weather. Low- and high-pressure extremes caused temperature and precipitation anomalies rich in contrast. Land surface snow cover, in general, was less throughout the northern hemisphere. In contrast, above-average snow accumulations and precipitation sums with cooler temperatures were observed in the north of the United States and parts of Canada. This winter in the Northern hemisphere was, on average, rich in variety, accompanied by warm and cold periods. Despite the arctic outbreaks, the winter was relatively dry, especially in snow.
