

Comparison of weather models for Johannesburg
The blue lines correspond to the forecasts computed by different high-resolution weather models. Also shown are the members of a traditional ensemble prediction, where the same weather model (GFS) is run several times with slightly different initial conditions, to reflect uncertainties in the observations required to run a forecast model. The GFS members have been downscaled and bias corrected to match local weather conditions, data from the high-resolution models is untouched.
- In the top graph, the temperature forecast for Johannesburg is shown using light blue for different high-resolution models and purple for the GFS ensemble members. The black line represents the best-fit temperature forecast as shown on our start page. The dashed lines show the GFS and ECMWF ensemble mean temperatures.
- The 2nd graph shows the accumulated precipitation forecast, that is the total amount that falls from today up to the date shown on the time axis. The blue bars show hourly precipitation sums.
- The 3rd graph is forecast cloud cover in percent using light blue for the high-resolution weather models and green for the GFS ensemble members.
- The 4th graph indicates the wind forecast as computed by high resolution models (light blue) and by the ensemble prediction (green). Also shown is the daily wind direction summary in form of a wind rose. Larger segments indicate that this wind direction is more likely and more frequent over the day than directions having smaller segments. If you have many segments of all about equal size than the forecast of wind direction is very uncertain. If there are predominantly two opposing directions this often indicates a thermal wind circulation where wind blows from a different direction during the day than at night.
Why do we show a traditional ensemble forecast and a multi model forecast at the same time?
A traditional ensemble (e.g. GFS) computed with the same forecast model often underestimates the uncertainties in the weather for the first 3 to 5 days thus overestimating the confidence in the forecast. Furthermore, the traditional ensemble is run at much lower resolution, thus neglecting some of the local weather phenomenon, which can be seen in high resolution models. It is very important to note, that all members of a traditional ensemble have the same likelihood of being true (there is no way to tell in advance which one will be better). This contrasts with the high-resolution models, where some deliver better forecasts than others depending on the location and weather conditions.
Weather models
Weather models simulate physical processes. A weather model divides the world or a region into small "grid-cells". Each cell is about 4km to 40km wide and 100m to 2km high. Our models contain 60 atmospheric layers and reach deep into the stratosphere at 10-25 hPa (60km altitude). The weather is simulated by solving complex mathematical equations between all grid cells every few seconds and parameters like temperature, wind speed or clouds are stored for every hour.
meteoblue operates a large number of weather models and integrates open data from various sources. All meteoblue models are computed twice a day on a dedicated High Performance Cluster.
| Model | Region | Resolution | Last update | Source | |
|---|---|---|---|---|---|
|
NEMS model family: Improved NMM successors (operational since 2013). NEMS is a multi-scale model (used from global down to local domains) and significantly improves cloud-development and precipication forecast. |
|||||
| NEMS4 | Central Europe | 4 km | 72 h | 20:43 SAST | meteoblue |
| NEMS12 | Europe | 12 km | 180 h | 21:39 SAST | meteoblue |
| NEMS2-12 | Europe | 12 km | 168 h | 00:28 SAST | meteoblue |
| NEMS-8 | Central America | 12 km | 180 h | 00:03 SAST | meteoblue |
| NEMS12 | India | 12 km | 180 h | 22:14 SAST | meteoblue |
| NEMS10 | South America | 10 km | 180 h | 00:11 SAST | meteoblue |
| NEMS10 | South Africa | 10 km | 180 h | 22:57 SAST | meteoblue |
| NEMS8 | New Zealand | 8 km | 180 h | 21:23 SAST | meteoblue |
| NEMS8 | Japan East Asia | 8 km | 180 h | 21:03 SAST | meteoblue |
| NEMS30 | Global | 30 km | 180 h | 20:27 SAST | meteoblue |
| NEMS2-30 | Global | 30 km | 168 h | 14:59 SAST | meteoblue |
|
NMM model family: the first weather model from meteoblue (operational since 2007). NMM is a regional weather model and highly optimised for complex terrain. |
|||||
| NMM4 | Central Europe | 4 km | 72 h | 19:38 SAST | meteoblue |
| NMM12 | Europe | 12 km | 180 h | 20:55 SAST | meteoblue |
| NMM18 | South America | 18 km | 180 h | 23:03 SAST | meteoblue |
| NMM18 | South Africa | 18 km | 180 h | 21:26 SAST | meteoblue |
| NMM18 | Southeast Asia | 18 km | 180 h | 22:00 SAST | meteoblue |
|
Third-party domains: As seen on most other websites |
|||||
| ECMWF-IFS | Global | 20 km | 144 h (@ 3 h) | 23:13 SAST | European Centre for Medium-Range Weather Forecasts (ECMWF) |
| ECMWF-ENS | Global | 30 km | 360 h (@ 3 h) | 23:36 SAST | European Centre for Medium-Range Weather Forecasts (ECMWF) |
| UKMO-10 | Global | 10 km | 144 h (@ 3 h) | 20:57 SAST | UK MET OFFICE |
| UKMO-2 | UK | 2 km | 120 h (@ 3 h) | 20:55 SAST | UK MET OFFICE |
| ICON7 | Europe | 7 km | 120 h (@ 3 h) | 18:39 SAST | Deutscher Wetterdienst |
| ICON13 | Global | 13 km | 180 h (@ 3 h) | 19:55 SAST | Deutscher Wetterdienst |
| ICON2 | Germany & Alps | 2.2 km | 48 h | 22:16 SAST | Deutscher Wetterdienst |
| GFS22 | Global | 22 km | 180 h (@ 3 h) | 18:34 SAST | NOAA NCEP |
| GFS22 | Global | 40 km | 180 h (@ 3 h) | 18:45 SAST | NOAA NCEP |
| GFSENS05 | Global | 40 km | 384 h (@ 3 h) | > 24h | NOAA NCEP |
| NBM | North America | 2.5 km | 180 h (@ 3 h) | 00:31 SAST | NOAA NCEP |
| HRRR | US | 3 km | 18 h | 00:27 SAST | NOAA NCEP |
| NAM3 | North America | 3 km | 60 h | 17:52 SAST | NOAA NCEP |
| NAM5 | North America | 5 km | 60 h | 19:25 SAST | NOAA NCEP |
| NAM12 | North America | 12 km | 84 h (@ 3 h) | > 24h | NOAA NCEP |
| FV3-5 | Alaska | 5 km | 60 h | 13:33 SAST | NOAA NCEP |
| GEM2 | North America | 2.5 km | 48 h | 20:58 SAST | Environment Canada |
| GEM15 | Global | 15 km | 168 h (@ 3 h) | 22:55 SAST | Environment Canada |
| AROME2 | France | 2 km | 42 h | 18:31 SAST | METEO FRANCE |
| ARPEGE11 | Europe | 11 km | 96 h | 18:05 SAST | METEO FRANCE |
| ARPEGE40 | Global | 40 km | 96 h (@ 3 h) | 18:36 SAST | METEO FRANCE |
| COSMO-5M | Central Europe | 5 km | 72 h | 21:31 SAST | AM/ARPAE/ARPAP |
| COSMO-2I | Central Europe | 2 km | 48 h | 21:55 SAST | AM/ARPAE/ARPAP |
| HRMN5 | Central Europe | 5 km | 48 h | 19:21 SAST | KNMI |
| MSM5 | Japan | 5 km | 78 h | 13:26 SAST | Japan Meteorological Agency |
| WRFAMS-7 | South America | 7 km | 168 h | 21:53 SAST | CPTEC/INPE |
Worldwide coverage
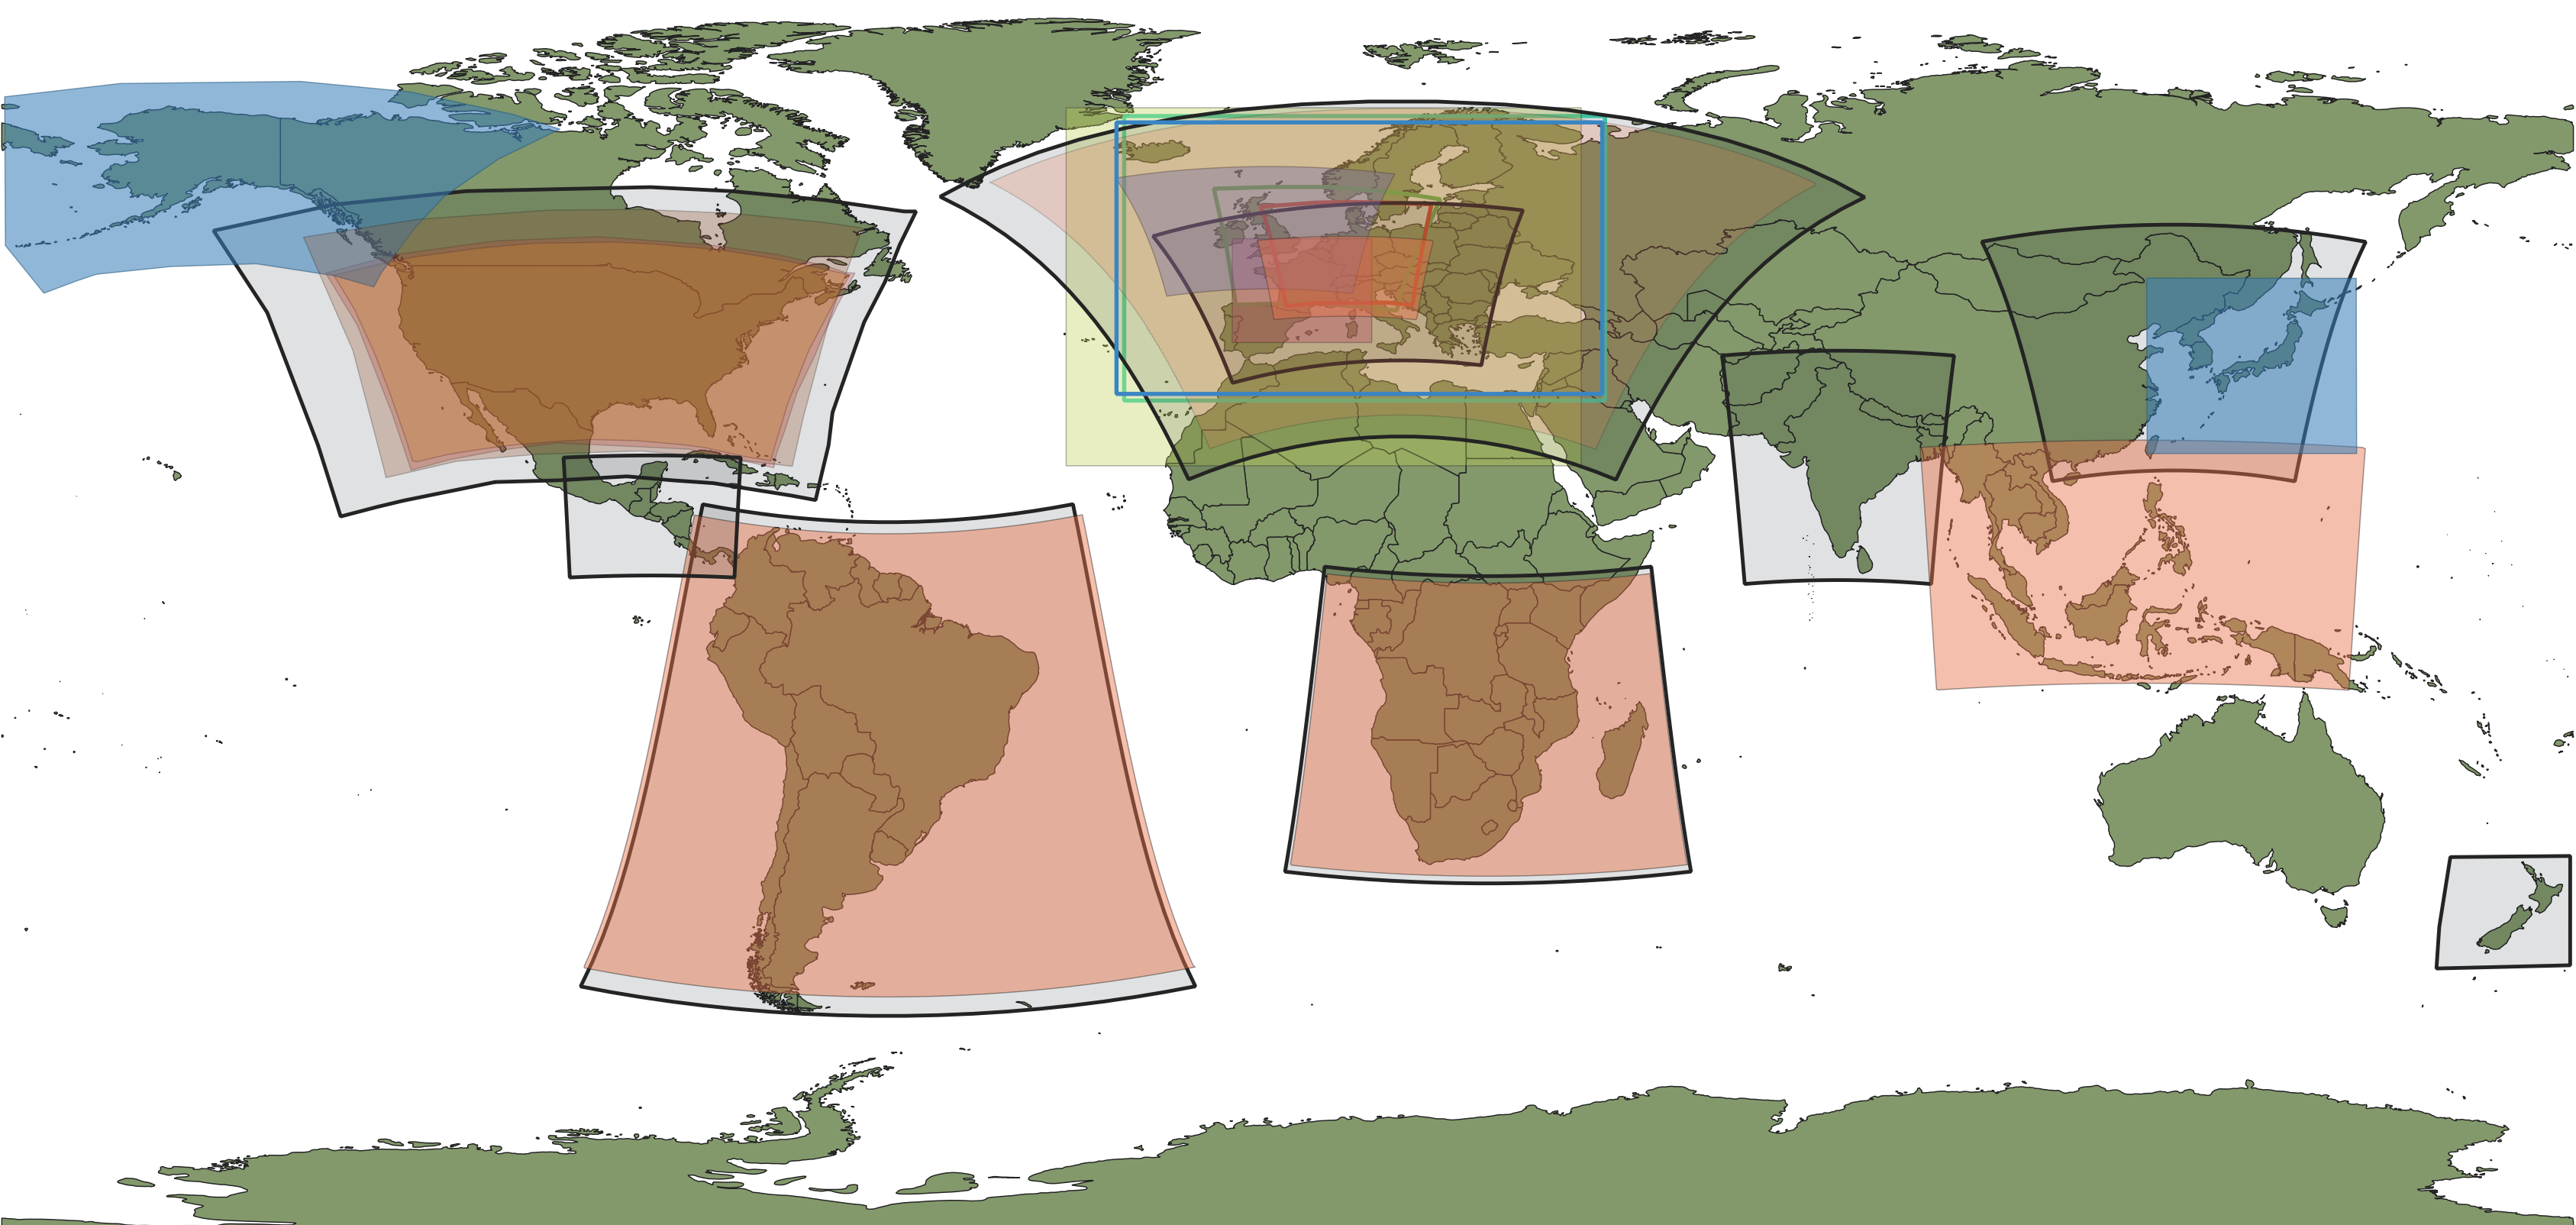 meteoblue weather models cover most populated areas at high resolution (3-10km) and world wide at moderate resolution (30km). The map on the side displays NMM models as red and NEMS models as black boxes. Other colors show third-party models. Global models are not shown. For a single forecast, multiple weather models, statistical analysis, measurements, radar and satellite telemetry are considered and combined to generate the most probable weather forecast for any given location on Earth.


