

The thermal and soaring forecast contains the most dense atmospheric data we ever put in a diagram to forecast flight conditions for paragliding, soaring and ballooning. The carefully assembled graphs include detailed information about surface conditions, stability indices, lapse rate, humidity, clouds and winds. It is separated into 4 parts:
Surface conditions
All diagrams show hourly data for Ái Tử for 3 days. Yellow areas indicate daylight.
- 2m temperature and 2m dewpoint: Equivalent with measurements 2 meters above ground. The 2m dewpoint temperature indicates how much water is in the air at ground level, from where potential thermals would start. A larger difference between temperature and dewpoint means less humidity and thus a higher cloud base. Fahrenheit is not yet supported.
- Precipitation: Total precipitation (rain, convective and snow) in millimeter rain gauge. As it takes a lot of heat to evaporate water, wet ground heats slower and is thus less favorable for thermals than dry ground. Also, thermals start earlier in dry conditions, when no rainfall happened before.
- 10m wind and 80m wind: Wind speeds in 10 and 80 meters above ground in kilometers per hour. Thermals develop under calm conditions or with light, variable wind. However, with 10 to 20 km/h wind, the thermals tend to be better organized. Stronger winds generally means also more wind above, which could produce wind shear, destroying the thermals. Look at the wind shear diagram.
Stability indices
Stability indices should not be understood as a summary of thermal conditions. Different stability indices often contradict each other and can at best provide some further insight into some aspects of soaring conditions. Unfortunately, there is no single index which summarizes the soaring conditions, thus consulting the lapse rate and wind shear diagrams shown below provides a much more accurate and conclusive picture. All Indices shown are scaled to fit 4 sections: poor, ok, good and excellent. Not all indices are reliable in all weather conditions or geographical regions. E.g., in dry climates CAPE and Lifted-Index underestimate soaring conditions, because of the low moisture in the atmosphere. On the other hand, especially in Winter with dry air, the Soaring-index can be very high, even though conditions are very poor.
- Soaring conditions daily summary (ThrHGT): For each day the maximum heights of dry
thermals as well as the maximum expected soaring height for a glider plane is given. Heights are in
meters above sea level. Similar to the other indices, the values are very approximate and not really
applicable in complex terrain. A value of 0m indicates that dry thermals do not support a glider plane.
Furthermore, the thermal index (TI) for 700, 800, 850 and 900 hPa (mb) is forecast. The more negative
the thermal index, the stronger the expected thermals:
Remember that the TI is a forecast value. A miss in the forecast maximum or a change in temperature aloft can alter the picture considerably.Thermal-Index Expected thermals -10 or -8 Very good lift and a long soaring day. Thermals are strong enough to hold together even on a windy day. -3 Very good chance of sailplanes reaching the altitude of this temperature difference. -2 to 0 A glider probably cannot reach the predicted soaring height. above 0 Unlikely to reach the indicated thermal or soaring height. - Updraft velocity / lift (m/s): An estimate of the maximum strength of thermals solely determined by surface conditions (heat, moisture and solar radiation). Uplift caused by wind is not considered (Mountain waves, convergence etc). Minimum 1.5 m/s, good 2 m/s, excellent >2.5 m/s.
- Soaring-Index: A measure of stability considering temperature
and humidity between 700 and 850 hPa. Be aware the Soaring-Index values can change significantly during
summer over short periods of time due to temperature and moisture advection. In the winter, when
temperatures are very cold, the moisture terms are very small. So, even the Soaring-Index is fairly
large, it does not mean that conditions are favorable for thunderstorms because of the lack of moisture.
The index gives no reliable data if the depth of the convection layer ends below 700 hpa.
Soaring-Index Soaring conditions below -10 no or weak thermals -10 to 5 dry thermals or 1/8 cumulus with moderate thermals 5 to 15 good soaring conditions 15 to 20 good soaring conditions with occasional showers 20 to 30 excellent soaring conditions, but increasing probability of showers and thunderstorms above 30 more than 60 percent probability of thunderstorms - Lifted-Index (LI): Another measure of instability (negative
values) or stability (positive values). Be aware that strongly negative values indicate excellent
soaring conditions, but severe thunderstorms are likely and could be very dangerous.
Lifted-Index Soaring conditions 6 or greater Very stable conditions 2 to 6 Stable conditions. Thunderstorms are not likely 0 to 2 Showers probable. Isolated thunderstorms possible 0 to -3 Slightly Unstable. Thunderstorms possible, With Lifting Mechanism (i.e., cold front, daytime heating, ...) -6 to -6 Unstable, Thunderstorms Likely, Some Severe With Lifting Mechanism below -6 Very Unstable, Severe Thunderstorms Likely With Lifting Mechanism - CAPE (J/kg): Convective Available Potential Energy is a measure of the atmospheric stability affecting deep convective cloud formation above the boundary layer. Higher values indicates larger updraft velocities and greater potential for thunderstorm development. Values around or greater than 1000 suggest the possibility of severe weather should convective activity develop.
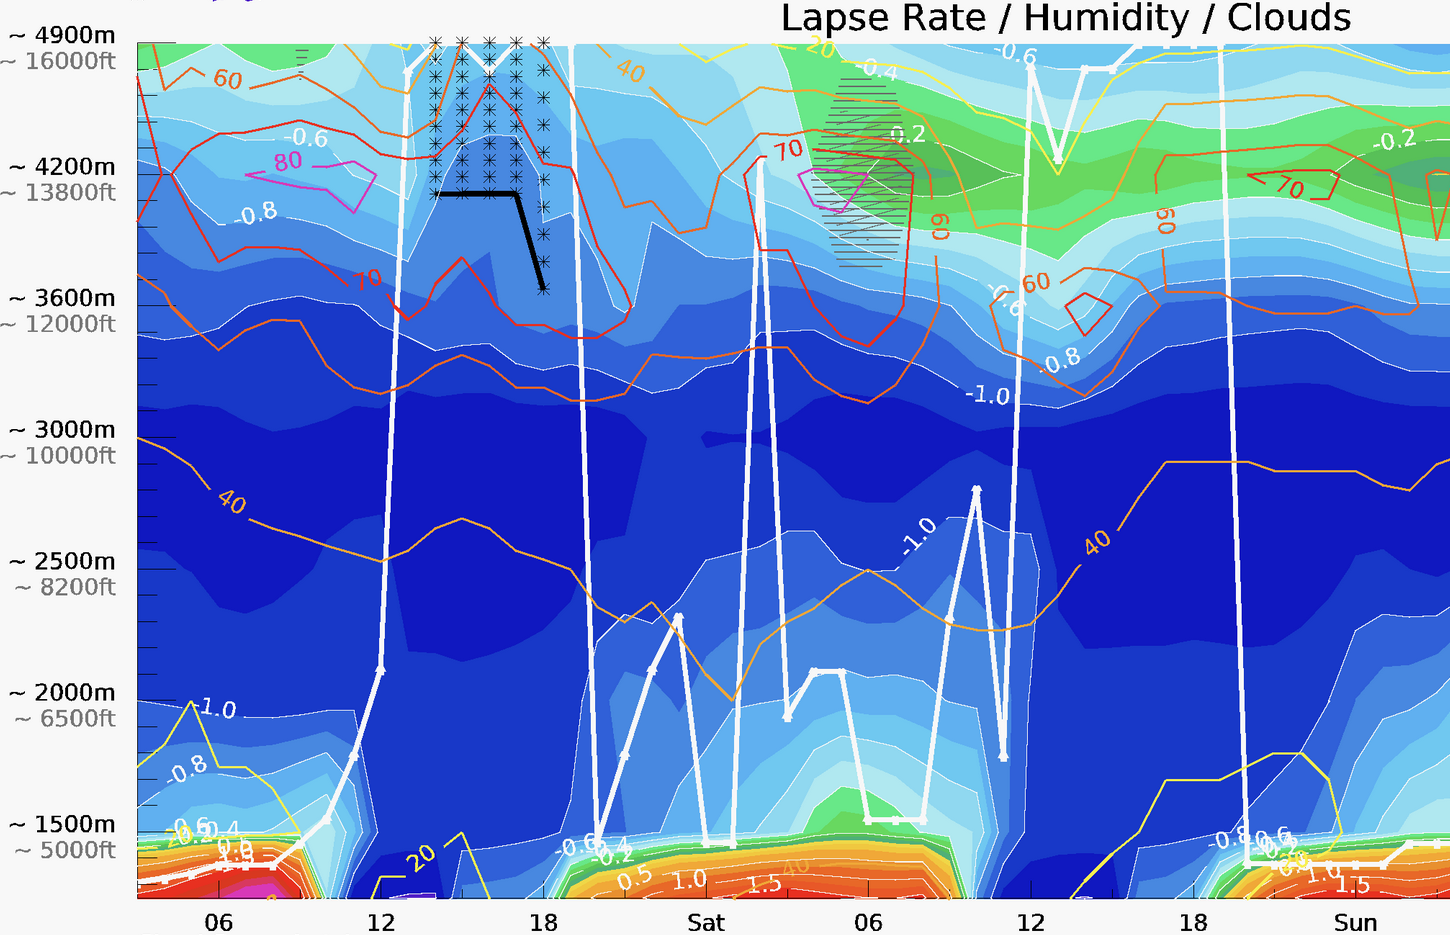
Lapse Rate / Humidity / Clouds
This graph shows an atmospheric profile over time and is the most important diagram to estimate soaring conditions. It provides an overview of the thermodynamic stability and clouds. The bottom of the diagram corresponds to the forecast model ground level, which might differ significantly from the actual location height in complex terrain. All color scales are fixed to compare forecasts at different locations and times. This diagram can get very crowded with information and thus become very hard to read, but that is a good thing because as a rule of thumb: "The harder to read, the worse the soaring!” What you are looking for are nice clean areas of high reaching dark blue plumes, with a high PBL height and maybe some small convective clouds developing above this plume in the afternoon as shown in the picture below.
This is an example of excellent soaring conditions as they occur frequently in Bitterwasser (Namibia), one of the best soaring spots in the world. Such conditions will never occur in most places, but you can find similar patterns reaching lower altitudes on good days almost everywhere.
- Lapse rate is measured in kelvin per 100m height difference. The exact value is printed with white labels on the contour lines. Inversions (very stable conditions) have positive values and are colored in yellow to red. The boundary between green and blue corresponds to the standard atmospheric conditions. Darker blues indicate conditions favourable for updrafts. Purple areas indicate dry unstable conditions which can only exist close the ground or for very short times in the atmosphere. This would make even stones fly. Surface instability up to 200 meters above ground is generally not shown. Important note: Lapse rate is an average caused by the mixing of up and down drafts. Actual updrafts can have much lower lapse rates.
- Relative humidity (thin colored lines): Convective clouds develop more likely in moist air.
- Convective clouds (astrix area): when convective clouds start developing, thermal soaring is at its best and finding thermals is greatly simplified. Thermals are beneath growing cumulus clouds. The convective cloud base is indicated as thick black line. Towering cumulus and cumulonimbus clouds have very strong updrafts and can thus become very dangerous.
- Cloud cover (hatched areas): Unless a hatched area is also marked with astrix (convective clouds), these clouds are no good for updrafts and also due to shading strongly reduce any potential development of updrafts.
- PBL height (thick white line): Planetary Boundary Layer height describes the average height a surface air parcel could move upwards. Buoyancy and wind (mechanical mixing) affect this height. Mixing due to convective clouds is not considered.
Horizontal Wind / Temperature / Vertical Wind Shear
Upper air wind conditions for the next days are displayed here. Strong wind shears are dangerous and should be avoided. Already weak wind shears disrupt thermals. The color scales are also fixed.
- Wind speed (colored background): Purple and dark blue represent calm winds. White numbers indicate the actual speed in kilometers per hour. Wind arrows show the horizontal wind direction and not up- or downdrafts. A downwards pointing arrow shows a north wind heading towards south.
- Temperature lines (thin colored lines): Small colored numbers show the temperature profile over time. Freezing level height (0°C) is marked as thick black line.
- Wind shear (thick colored lines): Wind shear can strongly disorganize thermals. Stronger larger thermals are more resistant to wind shear than smaller ones. Generally a shear of 2 km/h /100 m distorts thermals so that they are difficult to use. Especially for high values actual wind shears might be much stronger than indicated. The forecast values represent hourly mean values not resolving gust winds.


