
point+
Больше опций для этой метеограммы доступно в point+
Узнать больше

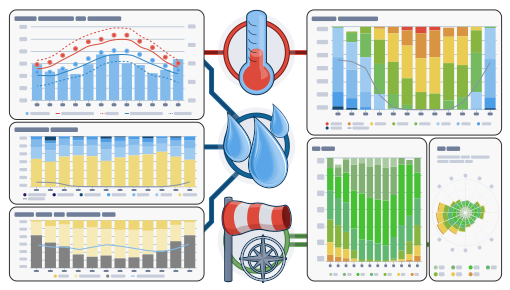
Архив истории симуляций предоставляет доступ к прошлым погодным моделированиям для любого места в мире. Вы можете посмотреть информацию о погоде за вчера или погодную историю последних лет. Диаграммы архива погоды разделены на 3 графика:
- Температура, включая относительную влажность с часовым шагом
- Облачность (серый фон) и ясное небо (светло-голубой фон). Чем темнее серый фон, тем плотнее облачный покров
- Скорость и направление ветра (в градусах: 0° = север, 90° = восток, 180° = юг и 270° = запад). В метеограмме архивной истории зелёная линия показывает скорость ветра, а роза ветров — направление ветра.
Please consider the following:
- The weather archive shows simulation data, not measured data, for the selected area.
- The data is not compared to measured data of a weather station (because in more than 99% of the places on Earth, no measurements are available). Simulation data with high predictability can replace measurements. For areas or data with lower predictability, simulation cannot replace measurements and can also not be used as an evidence.
- Wind and temperature data are calculated with the average altitude of the grid cell. Therefore, the temperatures for mountains and coasts can be a somewhat different from the data at the exact location which you have selected. You can find the altitude of the grid cell besides the coordinates.
- The "15-day" diagram shows hourly data. For one month, there are daily aggregations for minimum, maximum and average values. For more than 6 months there are monthly aggregations.
- We also offer raw data for sale. Please contact us for more information ([email protected])
Почасовые исторические данные о погоде с 1940 года для 54.95°С 48.78°В можно приобрести с помощью сервиса history+. Загружайте такие переменные, как температура, ветер, облачность и осадки, в формате CSV для любой точки Земли.