We are excited to announce the launch of our brand-new Landslide Probability Map, a sophisticated tool designed to identify areas at risk of slope failure across the globe. While most weather services focus solely on what’s happening in the sky, meteoblue is looking at how the weather impacts the ground beneath our feet.
This new map is a true rarity in the commercial weather world, offering a sophisticated view of terrain stability by integrating a complex variety of dynamic and static data points. By combining soil moisture and quality data with precipitation levels, topographic analysis of slope steepness, as well as a variety of other factors, the map visualises a risk index that was previously unavailable.
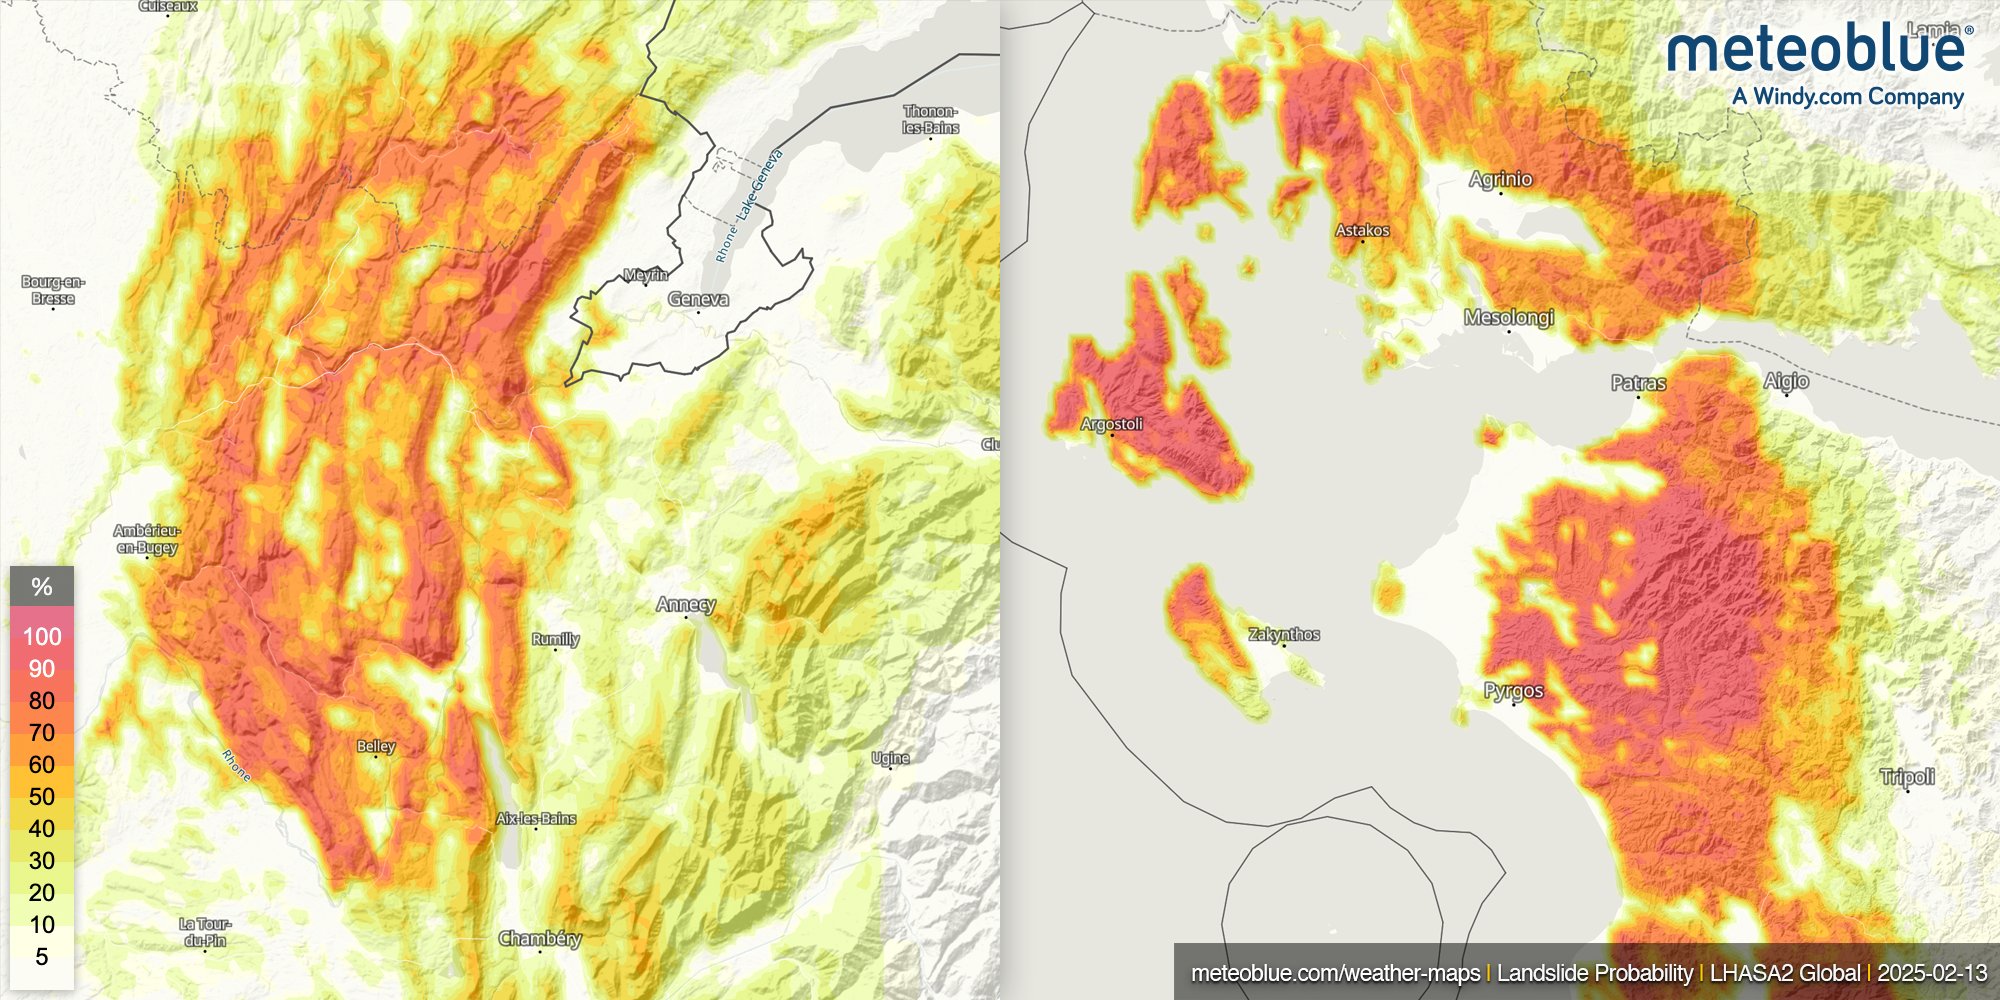
How to View the Map: A Note on Zoom
When you first open the Landslide Probability Map, it may appear largely blank. This is intentional, and actually good news: at any given moment, most of the world is not at immediate risk of a landslide. To see the data, users must zoom in on mountainous regions, hilly terrain, or areas recently affected by heavy rainfall. The map will only highlight specific high-probability zones where the environmental factors align to indicate a genuine risk.
The Global Cost of Ground Instability
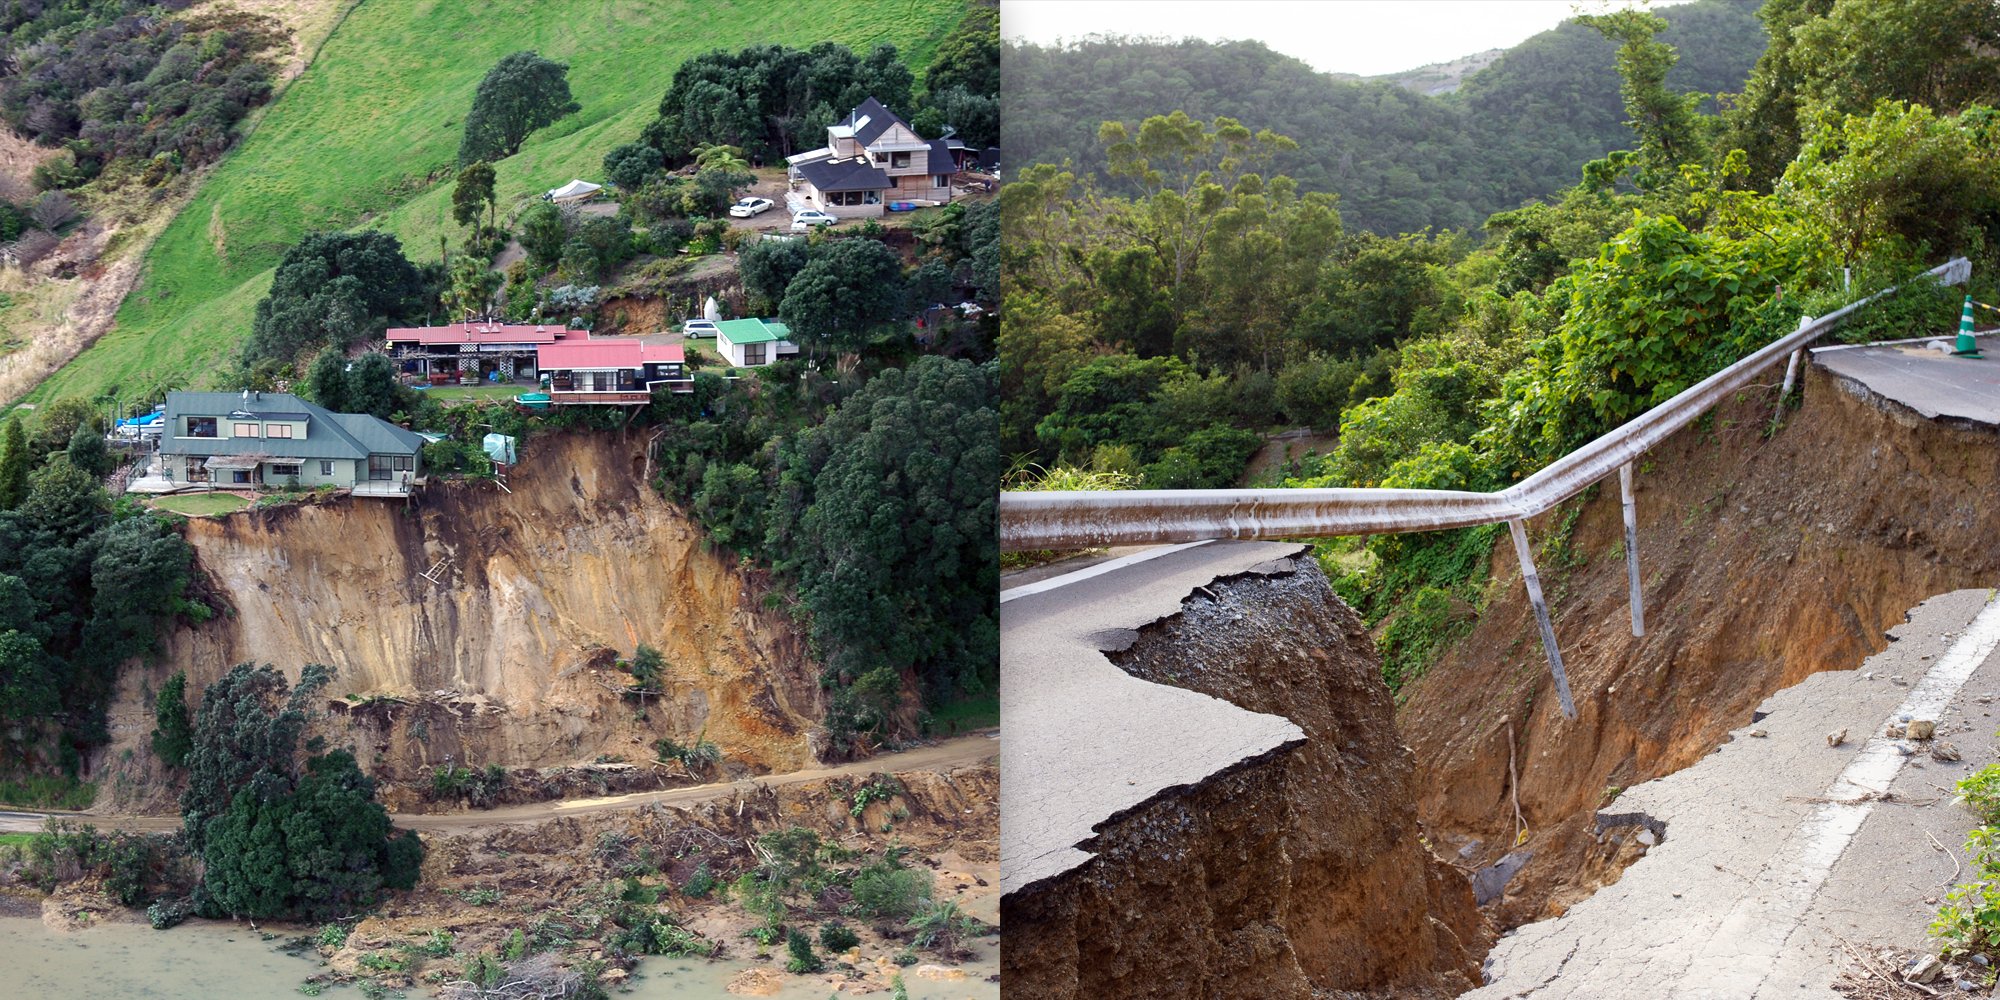
Landslides are one of the most destructive—yet under-reported—natural hazards, often occurring as "cascading disasters" following storms or wildfires. Globally, landslides are estimated to cause between $20 billion and $50 billion in economic losses every year, a figure that is trending upward as extreme weather events become more frequent.
Beyond the financial impact, the human toll is significant; between 1998 and 2017 alone, landslides affected an estimated 4.8 million people. Because these events can move at avalanche speeds, picking up trees and debris as they go, having a "heads up" on soil saturation and slope risk is a critical part of modern safety planning.
Strategic Use Cases for Risk Management
For public authorities and municipal leaders, landslide data is a cornerstone of resilient governance. Local governments use these probability maps to drive smart urban planning, ensuring that new housing developments or infrastructure projects avoid high-risk zones. In the wake of wildfires or extreme storms, emergency management agencies use this "risk-layering" to prioritise evacuation orders and allocate rescue resources. By identifying vulnerable slopes before failure occurs, public works departments can implement proactive stabilisation measures—such as improved drainage—saving millions in reconstruction costs and protecting lives.
On top of that, the meteoblue Landslide Probability Map also serves as a vital tool for situational awareness across multiple key industries. In the logistics and transport sectors, it helps operators identify potential road closures or rail blockages before they happen, allowing for safer rerouting. For construction and engineering firms, the map provides a preliminary assessment of site safety in mountainous or hilly regions, helping to protect both workers and machinery. Similarly, energy providers can use the data to monitor the stability of terrain surrounding critical infrastructure like pipelines, power lines, and dams. For the insurance and risk management industries, this tool offers a way to better quantify the "hidden" risks of property damage that often follow periods of intense, heavy rain.
Availability: Historical landslide data (previous day) is available to all users. Current and forecasted landslide probability is available to our point+ subscribers within the weather map interface. Go ahead and explore the world's terrain today!
