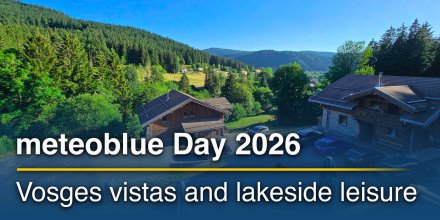
Webinar: Managing Weather Risk Across Energy Assets
Weather is hitting energy infrastructure harder, faster and at a greater cost than ever, and a live webinar on 17 June will show operators how to stay one step ahead of it!
The level of detail available in weather forecasts has increased dramatically in recent years. What once focused on broad regional patterns is increasingly moving towards local, street-scale prediction. Modern forecasts can now identify which urban areas will retain heat overnight, where cold air may accumulate, or which locations face the highest risk of intense rainfall and flooding.
|
|
|
|
|
|
|
|
||
|
Icon
|
|
|
|
|
|
|
|
|
|
°C
|
13°
|
8°
|
9°
|
22°
|
25°
|
21°
|
12°
|
9°
|
|
°C
|
10°
|
5°
|
6°
|
18°
|
21°
|
16°
|
7°
|
4°
|
|
|
S |
NE |
E |
SE |
SSE |
SSE |
E |
E |
|
km/h
|
2-5
|
2-5
|
1-4
|
5-9
|
7-12
|
6-11
|
9-11
|
7-10
|
|
mm
|
-
|
-
|
-
|
-
|
-
|
-
|
-
|
-
|
|
%
|
0%
|
0%
|
0%
|
0%
|
0%
|
0%
|
0%
|
0%
|
|
mm
|
||||||||
|
|
Brak opadów |
|||||||
|
20 km
|
||||||||
Ciśnienie: 1020 hPa
Strefa czasowa: CAT (UTC +02:00h)
Możesz osadzić ten meteogram na swojej stronie internetowej. Dostosuj go tutaj.
Obraz satelitarny w czasie rzeczywistym łączy światło widzialne w ciągu dnia z promieniowaniem podczerwonym w nocy. W nocy obraz nie jest ciemny, ponieważ promieniowanie podczerwone potrafi wykrywać różnice temperatur. Niestety, niskie chmury i mgła są trudne do odróżnienia od temperatury gruntu, przez co w nocy mogą być niemal niewidoczne. Obrazy satelitarne Meteosat dla Europy są aktualizowane w czasie rzeczywistym co 5 minut. Obrazy GOES-16/GOES-17 (Ameryka Północna i Południowa) oraz Himawari (Azja) są aktualizowane co 10 minut.
Opady są szacowane na podstawie danych z radarów i satelitów. Szacunki opadów z satelitów są mniej dokładne w nocy niż w ciągu dnia.
© 2026 meteoblue, NOAA Satellites GOES-16 and EUMETSAT. Dane o wyładowaniach dostarczone przez nowcast.
Znacznik lokalizacji został umieszczony na Mariental. Ta animacja pokazuje radar opadów dla wybranego przedziału czasowego oraz prognozę na 2h. Pomarańczowe krzyżyki oznaczają wyładowania atmosferyczne. Dane dostarczone przez nowcast.de (dostępne w USA, Europie i Australii). Mżawka lub lekki opad śniegu mogą być niewidoczne dla radaru. Intensywność opadów jest oznaczona kolorami od turkusowego do czerwonego.
Weather is hitting energy infrastructure harder, faster and at a greater cost than ever, and a live webinar on 17 June will show operators how to stay one step ahead of it!
The level of detail available in weather forecasts has increased dramatically in recent years. What once focused on broad regional patterns is increasingly moving towards local, street-scale prediction. Modern forecasts can now identify which urban areas will retain heat overnight, where cold air may accumulate, or which locations face the highest risk of intense rainfall and flooding.
Reklama jest niezbędna, aby utrzymać naszą bezpłatną stronę z unikalnymi szczegółami i dokładnością.
Prosimy o dodanie www.meteoblue.com do białej listy w Twoim blokerze reklam lub rozważ zakup jednego z naszych produktów:
Masz już subskrypcję?
W takim razie prosimy o logowanie.