
point+
Mai multe opțiuni pentru acest meteogram sunt disponibile cu point+
Află mai multe

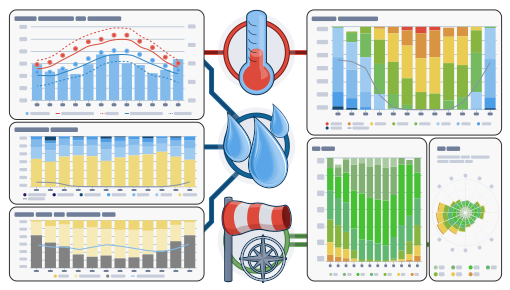
Arhiva istorică de simulare oferă acces la simulări meteorologice trecute pentru orice loc din lume. Puteți vedea informații meteo pentru ieri sau istoricul vremii din ultimii ani. Diagramele din arhiva meteo sunt împărțite în 3 grafice:
- Temperatură, inclusiv umiditatea relativă la intervale orare
- Nori (fundal gri) și cer senin (fundal albastru deschis). Cu cât fundalul gri este mai închis, cu atât acoperirea de nori este mai densă
- Viteză și direcție a vântului (în grade
Please consider the following:
- The weather archive shows simulation data, not measured data, for the selected area.
- The data is not compared to measured data of a weather station (because in more than 99% of the places on Earth, no measurements are available). Simulation data with high predictability can replace measurements. For areas or data with lower predictability, simulation cannot replace measurements and can also not be used as an evidence.
- Wind and temperature data are calculated with the average altitude of the grid cell. Therefore, the temperatures for mountains and coasts can be a somewhat different from the data at the exact location which you have selected. You can find the altitude of the grid cell besides the coordinates.
- The "15-day" diagram shows hourly data. For one month, there are daily aggregations for minimum, maximum and average values. For more than 6 months there are monthly aggregations.
- We also offer raw data for sale. Please contact us for more information ([email protected])
Date meteorologice orare istorice începând cu 1940 pentru Mount Thymanan pot fi achiziționate cu history+. Descărcați variabile precum temperatura, vântul, nebulozitatea și precipitațiile în format CSV pentru orice loc de pe Pământ.