

Porovnání modelů počasí pro Houston Country Club
Modré čáry korespondují s předpověďmi, které byly přepočítány různými modely počasí s vysokým rozlišením. Rovněž jsou zobrazeni členové tradiční skupinové předpovědi, v jejímž rámci je stejný model počasí (GFS) spuštěn několikrát s mírně odlišnými počátečními podmínkami tak, aby odrážel nepravidelnosti v pozorováních, které jsou nutné pro spuštění modelu předpovědi. GFS členové byli zmenšení a tendence upraveny tak, aby odpovídaly místním povětrnostním podmínkám; údaje z modelů s vysokým rozlišením jsou nedotčené.
- V horním grafu je předpověď teploty pro Houston Country Club znázorněna světle modře pro různé modely s vysokým rozlišením a fialově pro členy ensemble souboru GFS. Černá čára představuje nejlépe odpovídající předpověď teploty, jak je uvedeno na naší úvodní stránce. Přerušované čáry znázorňují průměrné teploty ensemble souborů GFS a ECMWF.
- 2nd graf ukazuje akumulovanou předpověď srážek, tj. celkové množství, které spadne ode dneška do data uvedeného na časové ose. Modré sloupce ukazují hodinové úhrny srážek.
- Třetí graf je předpověď oblačnosti v procentech, kde je světle modrá barva použita pro modely počasí s vysokým rozlišením a zelená pro členy GFS skupiny.
- Čtvrtý graf indikuje větrnou předpověď tak, jak je přepočítána modely s vysokým rozlišením (světle modrá) a skupinovou předpovědí (zelená). Také je zobrazen souhrn směru větru ve podobě větrné růžice. Větší segmenty indikují, že tento směr větru je pravděpodobnější a častější v průběhu dne než směry větru s menšími segmenty. Pokud jsou dominantní dva protilehlé směry, často to znamená, že jde o termální cirkulaci vzduchu, kde vítr během dne fouká z jiného směru než během noci.
Proč zobrazujeme tradiční skupinovou předpověď a zároveň multimodelovou předpověď?
Tradiční skupina (např. GFS) přepočítána stejným předpovědním modelem často podceňuje nepravidelnosti v počasí během prvních 3 až 5 dní a tedy přeceňuje důvěru v předpovědi. Navíc, tradiční skupina se spouští při mnohem menším rozlišení a tedy zanedbává některé z místních povětrnostních fenoménů, které mohou být zobrazeny v modelech s vysokým rozlišením. Je velmi důležité pamatovat, že všichni členové tradiční skupiny mají stejnou pravděpodobnost pravdivosti (neexistuje způsob, jak dopředu říct, který bude lepší). Toto je v kontrastu s modely s vysokým rozlišením, kde některé dodají lepší předpovědi než jiné, v závislosti na poloze a povětrnostních podmínkách.
Modely počasí
Modely počasí simuluji fyzikální procesy. Model počasí rozděluje svět nebo region do malých "buněk mřížky". Každá buňka je asi 4 km až 40 km široká a 100m až 2 km vysoká. Naše modely obsahují 60 atmosférických vrstvev a sahají hluboko do stratosféry na 10 až 25 hPa (60 km nadmořské výšky). Počasí je simulováno řešením složitých matematických rovnic mezi všemi buňkami mřížky každých pár sekund a parametry, jako je teplota, rychlost větru nebo mraky jsou uloženy pro každou hodinu.
meteoblue provozuje velké množství meteorologických modelů a integruje přístupné data z různých zdrojů. Všechny meteoblue modely jsou počítány dvakrát denně na vyhrazeném vysoce výkonném klastru.
| Model | Oblast | Rozlišení | Poslední aktualizace | Zdroj | |
|---|---|---|---|---|---|
|
Skupina modelů NEMS:Lepší NMM nástupci (v provoze od roku 2013). NEMS je mnoho-stupnicový model (používá se od globálních až po lokální domény) a výrazně zlepšuje předpověď srážek a vývoj mraků. |
|||||
| NEMS-4 | Střední Evropa | 4.0 km | 72 h | 13:43 UTC | meteoblue |
| NEMS-12 | Evropa | 12.0 km | 180 h | 14:39 UTC | meteoblue |
| NEMS-30 | Global | 30.0 km | 180 h | 13:27 UTC | meteoblue |
| NEMS-8 | Nový Zéland | 8.0 km | 180 h | 14:24 UTC | meteoblue |
| NEMS-10 | Indie | 10.0 km | 180 h | 15:16 UTC | meteoblue |
| NEMS-8 | Japonsko Východní Asie | 8.0 km | 180 h | 14:05 UTC | meteoblue |
| NEMS-12 | Střední Amerika | 12.0 km | 180 h | 17:00 UTC | meteoblue |
| NEMS-10 | Jižní Afrika | 10.0 km | 180 h | 15:51 UTC | meteoblue |
| NEMS2-12 | Evropa | 12.0 km | 168 h | 17:35 UTC | meteoblue |
| NEMS2-30 | Global | 30.0 km | 168 h | 19:15 UTC | meteoblue |
| NEMS-10 | Jižní Amerika | 10.0 km | 180 h | 17:09 UTC | meteoblue |
|
Skupina modelů NMM:první model počasí z meteoblue (v provozu od roku 2007). NMM je regionální model počasí a vysoce optimalizovan pro složitý terén. |
|||||
| NMM-4 | Střední Evropa | 4.0 km | 72 h | 12:37 UTC | meteoblue |
| NMM-12 | Evropa | 12.0 km | 180 h | 13:58 UTC | meteoblue |
| NMM-18 | Jižní Afrika | 18.0 km | 180 h | 14:24 UTC | meteoblue |
| NMM-18 | Jižní Amerika | 18.0 km | 180 h | 16:00 UTC | meteoblue |
| NMM-18 | Jihovýchodní Asie | 18.0 km | 180 h | 14:56 UTC | meteoblue |
|
Domény třetích stran: Jak jsou viděny na většině jiných webových stránkách |
|||||
| IFSENS-40 | Global | 30.0 km | 360 h (@ 3hourly h) | 16:35 UTC | ECMWF |
| GFSENS-40 | Global | 40.0 km | 384 h (@ 3hourly h) | 15:21 UTC | NOAA NCEP |
| GFS-25 | Global | 22.0 km | 180 h (@ 3hourly h) | 11:34 UTC | NOAA NCEP |
| GFS-12 | Global | 12.0 km | 180 h (@ 3hourly h) | 11:55 UTC | NOAA NCEP |
| IFS-20 | Global | 20.0 km | 144 h (@ 3hourly h) | 16:15 UTC | ECMWF |
| ICON-12 | Global | 13.0 km | 180 h (@ 3hourly h) | 12:33 UTC | Deutscher Wetterdienst |
| ICON-7 | Evropa | 7.0 km | 120 h (@ 3hourly h) | 11:24 UTC | Deutscher Wetterdienst |
| ICOND-2 | Germany and Alps | 2.0 km | 48 h | 18:14 UTC | Deutscher Wetterdienst |
| HARMN-5 | Střední Evropa | 5.0 km | 48 h | 18:21 UTC | KNMI |
| GFS-40 | Global | 40.0 km | 180 h (@ 3hourly h) | 11:45 UTC | NOAA NCEP |
| NAM-12 | Severní Amerika | 12.0 km | 84 h (@ 3hourly h) | 10:09 UTC | NOAA NCEP |
| NAM-5 | Severní Amerika | 5.0 km | 48 h | 12:22 UTC | NOAA NCEP |
| NAM-3 | Severní Amerika | 3.0 km | 60 h | 10:53 UTC | NOAA NCEP |
| HRRR-2 | Severní Amerika | 3.0 km | 17 h | 20:28 UTC | NOAA NCEP |
| FV3-5 | Alaska | 5.0 km | 48 h | 18:30 UTC | NOAA NCEP |
| ARPEGE-40 | Global | 40.0 km | 96 h (@ 3hourly h) | 11:32 UTC | METEO FRANCE |
| ARPEGE-11 | Evropa | 11.0 km | 96 h | 11:05 UTC | METEO FRANCE |
| AROME-2 | Francie | 2.0 km | 42 h | 11:33 UTC | METEO FRANCE |
| UKMO-10 | Global | 10.0 km | 144 h (@ 3hourly h) | 14:00 UTC | UK MET OFFICE |
| GEM-15 | Global | 15.0 km | 168 h (@ 3hourly h) | 15:48 UTC | Environment Canada |
| RDPS-2 | Severní Amerika | 2.5 km | 48 h | 13:58 UTC | Environment Canada |
| MSM-5 | Japan | 5.0 km | 78 h | 18:26 UTC | Japan Meteorological Agency |
| UKMO-2 | UK/France | 2.0 km | 120 h (@ 3hourly h) | 13:56 UTC | UK MET OFFICE |
| COSMO-5 | Střední Evropa | 5.0 km | 72 h | 14:31 UTC | AM/ARPAE/ARPAP |
| COSMO-2 | Alps/Italy | 2.0 km | 48 h | 14:55 UTC | AM/ARPAE/ARPAP |
| NBM-2 | Severní Amerika | 2.5 km | 180 h (@ 3hourly h) | 20:31 UTC | NOAA NCEP |
| WRFAMS-7 | Jižní Amerika | 7.0 km | 168 h | 16:26 UTC | CPTEC/INPE |
| AIFS-25 | Global | 25.0 km | 180 h (@ 3hourly h) | 15:15 UTC | ECMWF |
| CAMS-10 | Evropa | 10.0 km | 96 h | 05:02 UTC | ECMWF Copernicus |
| CAMS-40 | Global | 40.0 km | 120 h (@ 3hourly h) | 17:08 UTC | ECMWF Copernicus |
| WW3-25 | Global | 25.0 km | 180 h (@ 3hourly h) | 14:15 UTC | NOAA NCEP |
| WW3-4 | Baltic/Arctic | 4.0 km | 72 h | 17:04 UTC | MET Norway |
| GWAM-25 | Global | 25.0 km | 174 h (@ 3hourly h) | > 24h | DWD |
| EWAM-5 | Evropa | 5.0 km | 78 h | 11:43 UTC | DWD |
| MFWAM-8 | Global | 8.0 km | 228 h (@ 3hourly h) | 16:45 UTC | Copernicus / MeteoFrance |
| MEDWAM-4 | Mediterranean | 4.0 km | 204 h | 01:32 UTC | Copernicus |
| IBIWAM-5 | Iberian Biscay Irish | 5.0 km | 216 h | 09:11 UTC | Copernicus |
| BALWAM-2 | Baltic | 2.0 km | 144 h | 17:27 UTC | Copernicus / FMI |
| RTOFS-9 | Global | 9.0 km | 192 h (@ 3hourly h) | 20:18 UTC | NOAA NCEP |
Celosvětové pokrytí
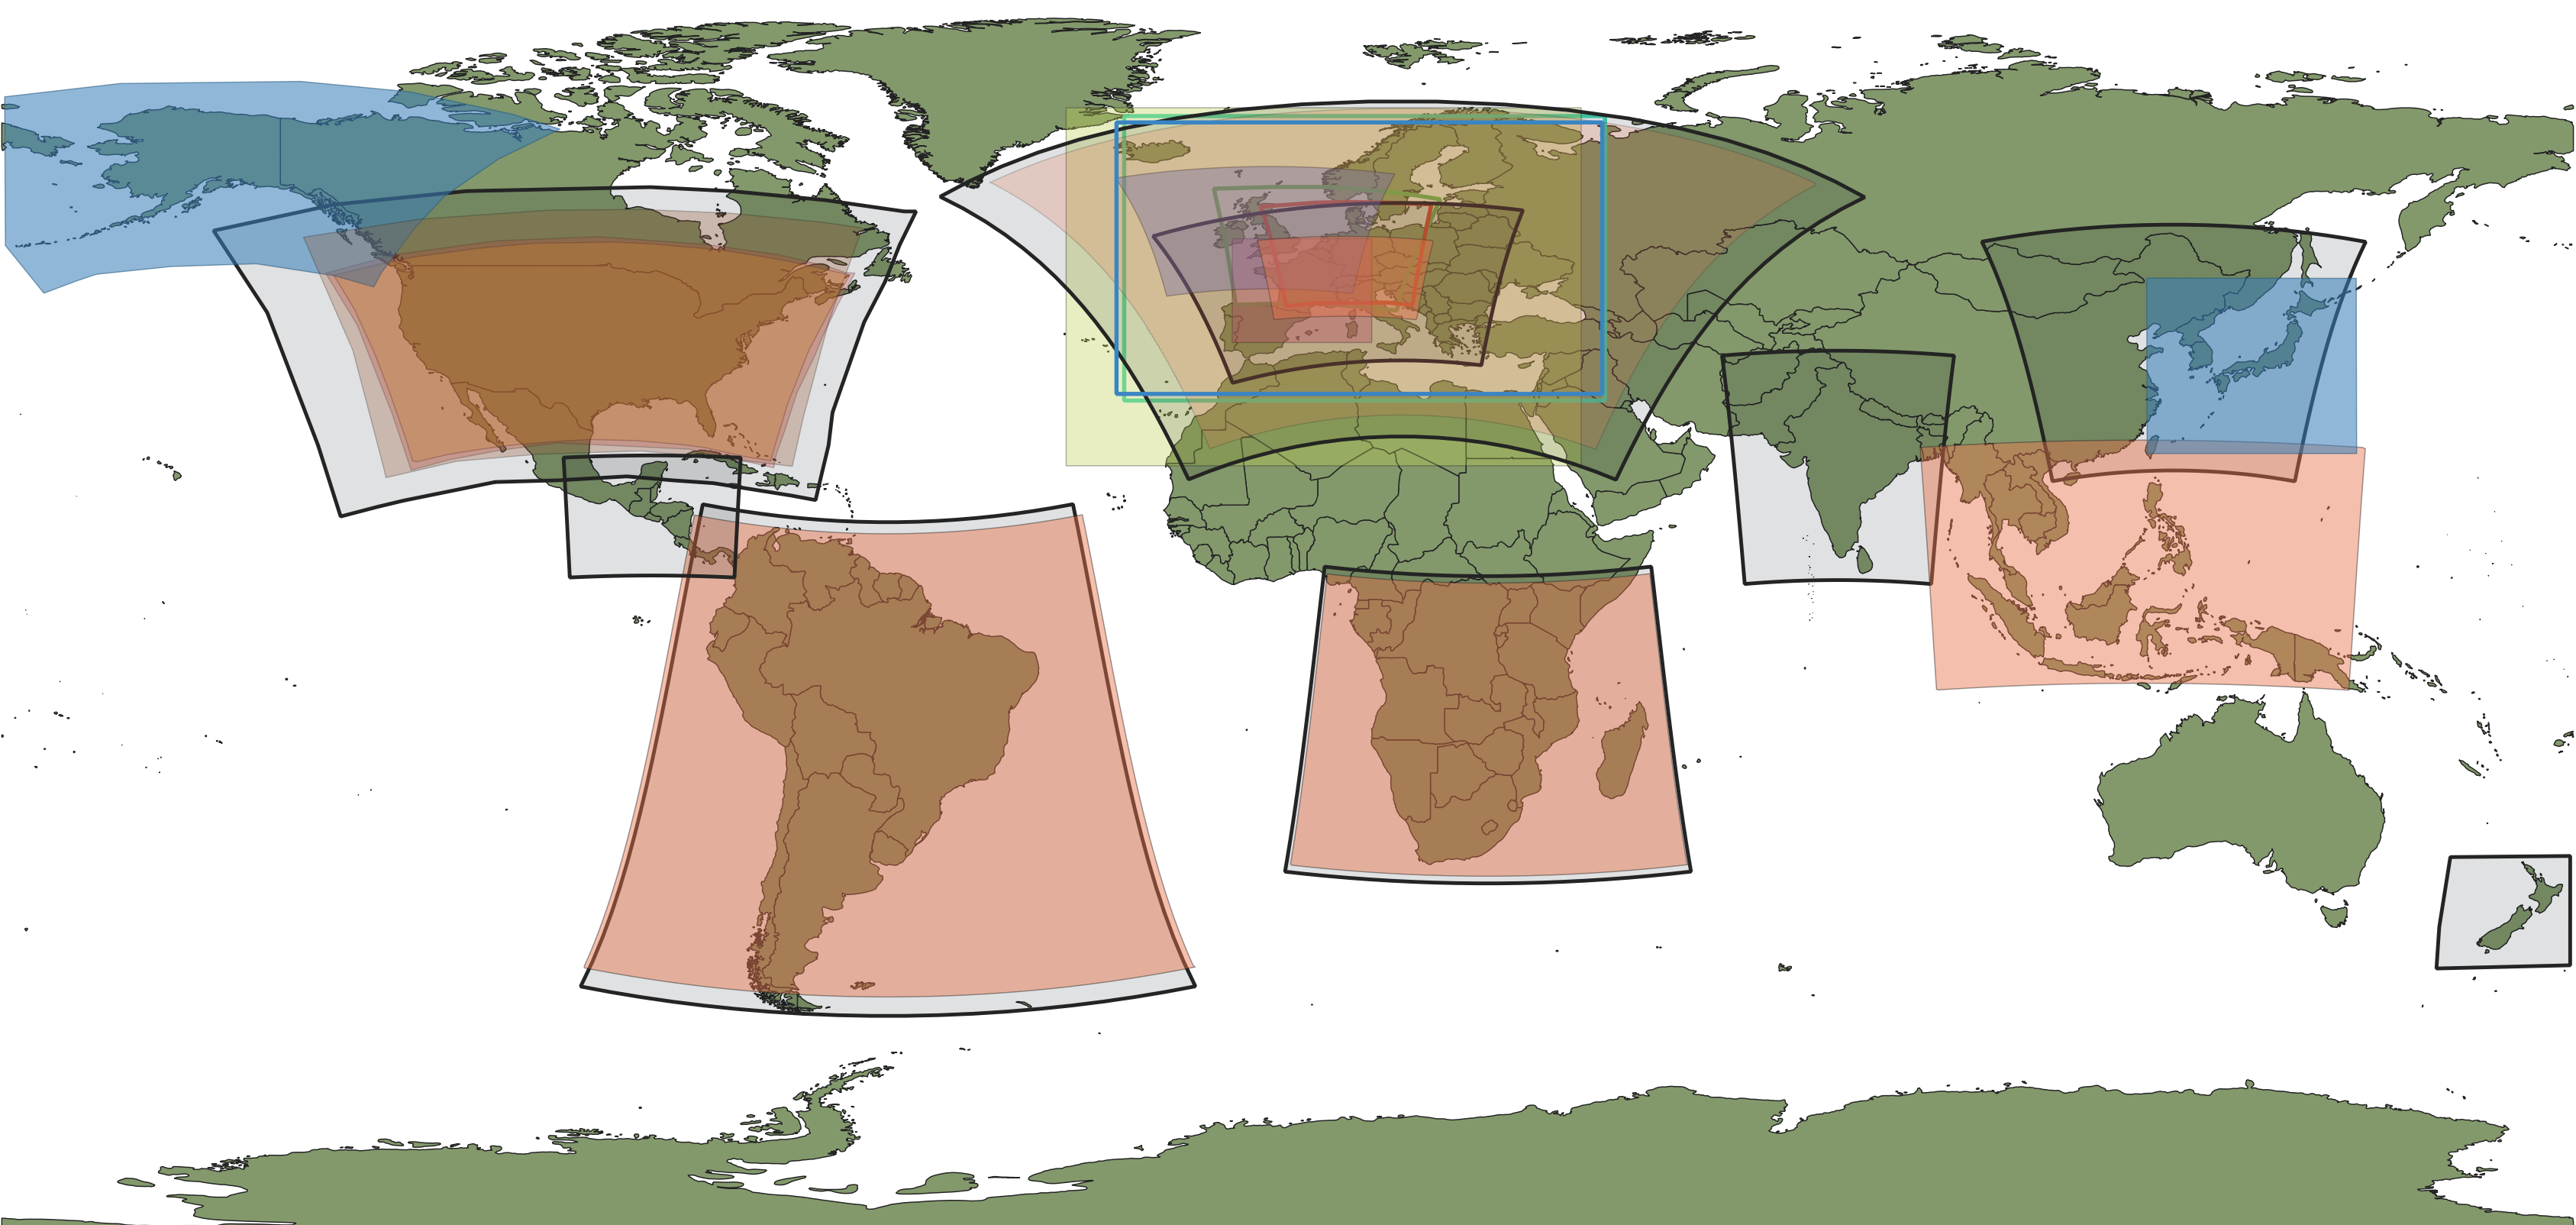 meteoblue modely počasí pokrývají většinu obydlených oblastí ve vysokém rozlišení (3-10 km) a celý svět ve středním rozlišení (30 km). Na boční mapě jsou modely NMM zobrazeny červeně a modely NEMS černě. Ostatní barvy zobrazují modely třetích stran. Globální modely nejsou zobrazeny. Pro jednu předpověď se bere v úvahu více modelů počasí, statistická analýza, měření, radary a satelitní telemetrie, které se kombinují, aby se vytvořila nejpravděpodobnější předpověď počasí pro dané místo na Zemi.


