
point+
Meer opties voor dit meteogram zijn beschikbaar met point+
Meer informatie

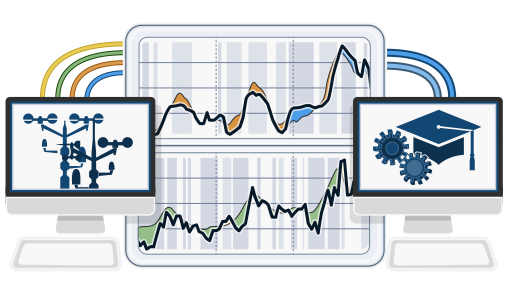
Het simulatiegeschiedenisarchief biedt toegang tot eerdere weersimulaties voor iedere plaats ter wereld. Je kunt weerinformatie van gisteren bekijken of de weerhistorie van de afgelopen jaren. De diagrammen van het weerarchief zijn onderverdeeld in 3 grafieken:
- Temperatuur, inclusief relatieve vochtigheid in uurlijkse intervallen
- Wolken (grijze achtergrond) en heldere hemel (lichtblauwe achtergrond). Hoe donkerder de grijze achtergrond, hoe dichter de wolkendeken is
- Windsnelheid en ‑richting (in graden
Please consider the following:
- The weather archive shows simulation data, not measured data, for the selected area.
- The data is not compared to measured data of a weather station (because in more than 99% of the places on Earth, no measurements are available). Simulation data with high predictability can replace measurements. For areas or data with lower predictability, simulation cannot replace measurements and can also not be used as an evidence.
- Wind and temperature data are calculated with the average altitude of the grid cell. Therefore, the temperatures for mountains and coasts can be a somewhat different from the data at the exact location which you have selected. You can find the altitude of the grid cell besides the coordinates.
- The "15-day" diagram shows hourly data. For one month, there are daily aggregations for minimum, maximum and average values. For more than 6 months there are monthly aggregations.
- We also offer raw data for sale. Please contact us for more information ([email protected])
Uurlijkse historische weergegevens sinds 1940 voor Atlantic kunnen worden aangeschaft met history+. Download variabelen zoals temperatuur, wind, bewolking en neerslag als CSV voor elke plek op aarde.