This is a series of articles examining heatwaves from every angle, exploring their causes, consequences, and the science behind them. It includes eight parts:
- Introduction
- Heatwave patterns
- Impacts on human health
- Impacts on urban areas
- Extreme heat in 2024
- Are heatwaves linked to climate change?
- Adapting to more frequent periods of extreme heat
- Temperature, apparent temperature, and heat indices
Heatwaves and extreme temperatures have particularly strong effects in urban environments. Cities experience what is known as the urban heat island effect, where temperatures are significantly higher than in surrounding rural areas. Dense building structures, asphalt surfaces, a lack of greenery, and high population density all contribute to cities heating up more during the day and cooling down less at night.
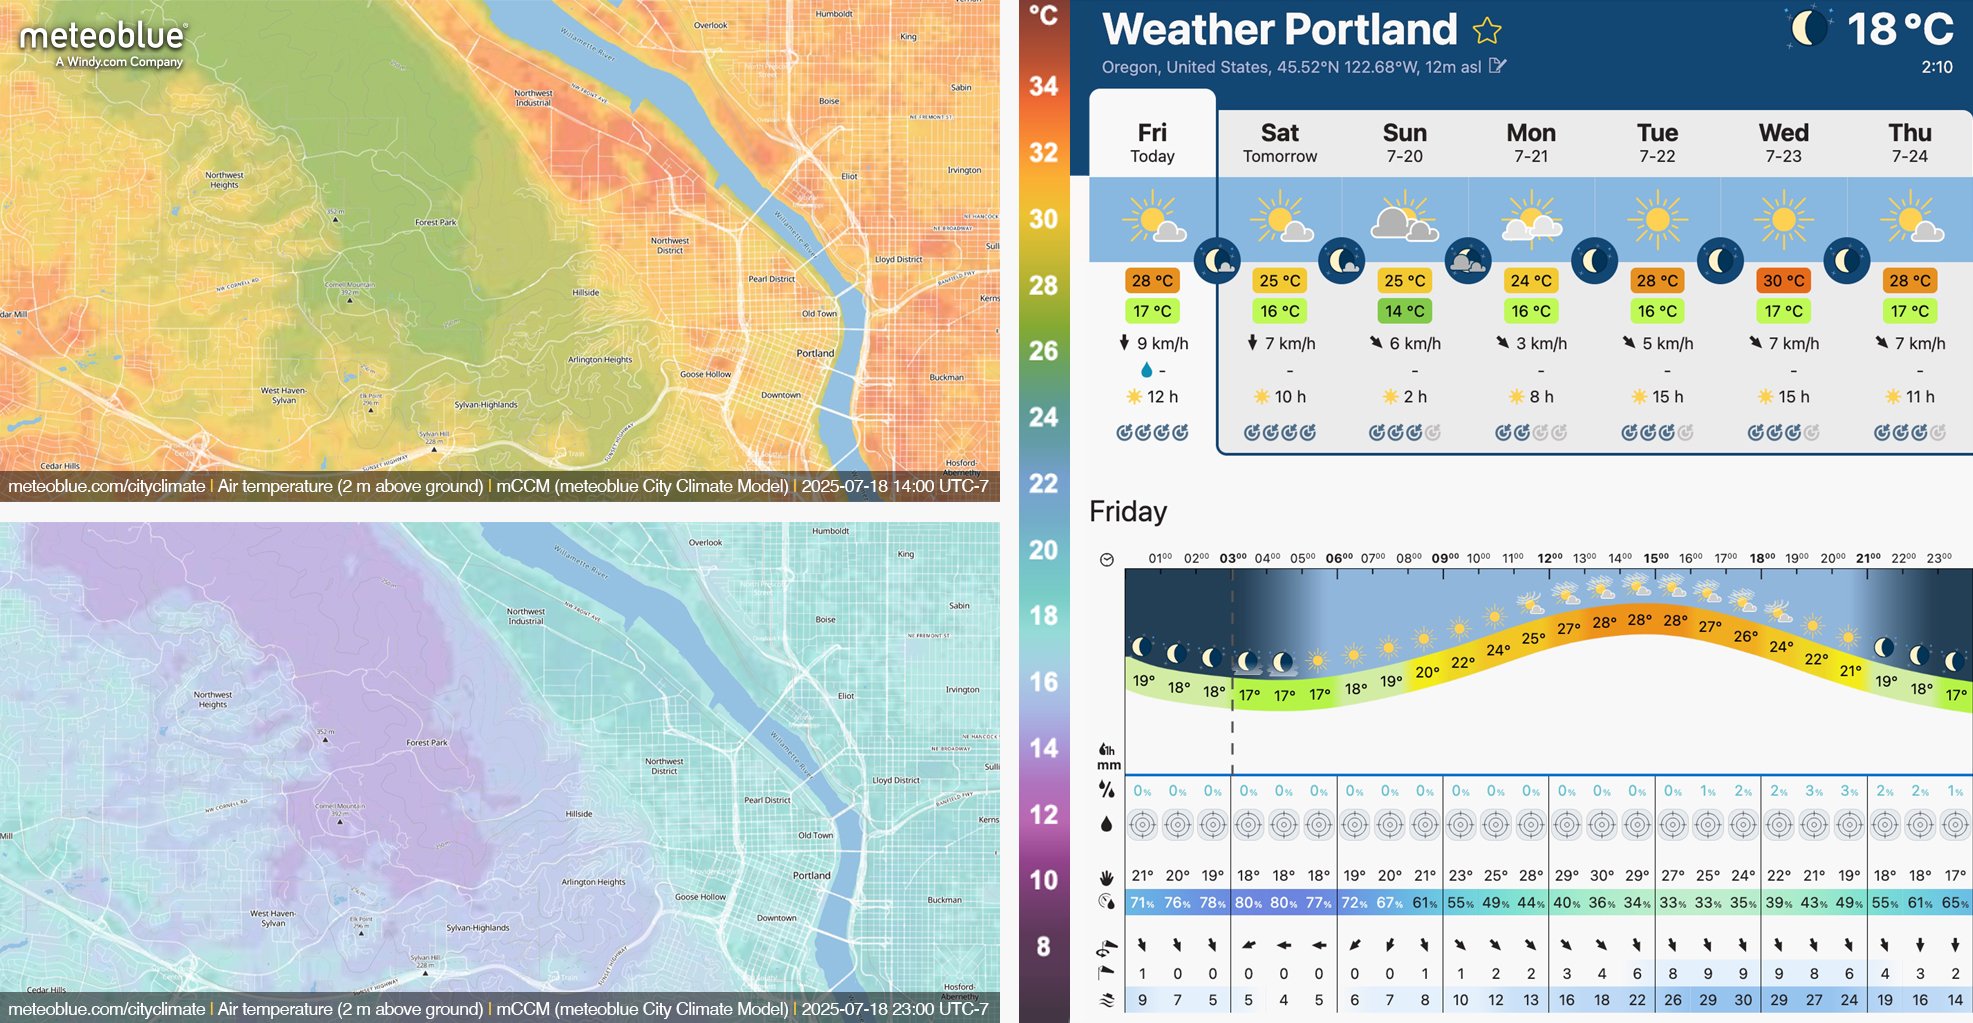
Temperature maps of Portland, Oregon, USA, on July 18, 2025, at 2:00pm and 11:00pm highlight stark contrasts in urban heat distribution. Forested areas remained significantly cooler throughout the day, while densely build neighbourhoods formed distinct urban heat islands and retained heat well into the night.
As a result, temperatures during heatwaves are often higher in cities than in the surrounding countryside and remain elevated even at night, making it difficult for the human body to recover. Urban areas can be 5 to 10 °C hotter than nearby rural regions, which intensifies heatwaves and increases the associated risks.
In 2023, the temperature difference between the surface of London and its surrounding rural areas in the United Kingdom reached up to 7 °C. The largest differences occurred during the summer months, when the heat accumulated throughout the day could not fully dissipate during the short night.
According to the United Nations, 55% of the world’s population lived in cities in 2018. The degree of urbanisation varies significantly by region — while 82% of people in North America live in urban areas, the figure is 65% in China and only 43% in Africa. By 2050, the global urban population is projected to rise to 68%.
Explore how our tools help you prepare for heatwaves: Urban Heat Maps offer hyper‑local temperature insights tailored to city planning and public health, climate+ provides long-term modelled and observed climate data for strategic adaptation, and point+ delivers precise, customisable weather forecasts for any location.
This article is based in part on original work provided by Jaroslava Sochorova (Windy.com), which has been adapted and edited by meteoblue.
