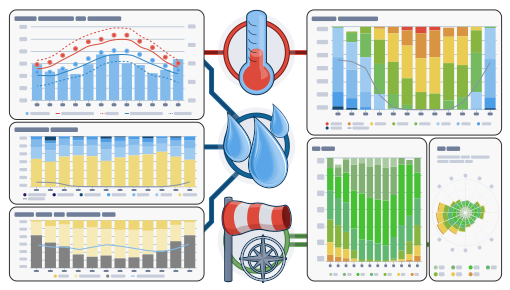

point+
Mais opções para este meteograma estão disponíveis através de point+
Saber mais

A simulação do arquivo de história oferece acesso a simulações climáticas passadas para todo e qualquer lugar do mundo. Você pode ver informações sobre o tempo de ontem ou a história meteorológica dos últimos anos. Os diagramas do arquivo meteorológico estão divididos em três gráficos:
- Temperatura, incluindo a humidade relativa em intervalos de uma hora
- Nuvens (fundo cinza) e céu limpo (fundo amarelo). Quanto mais escuro é o fundo cinza, mais densa é a cobertura de nuvens
- Velocidade e direção do vento (em graus de 0° = Norte, 90° = Este, 180º = Sul e 270° = Oeste). No meteograma do arquivo de história, os pontos roxos representam a direção do vento, conforme indicado no eixo da direita.
Please consider the following:
- The weather archive shows simulation data, not measured data, for the selected area.
- The data is not compared to measured data of a weather station (because in more than 99% of the places on Earth, no measurements are available). Simulation data with high predictability can replace measurements. For areas or data with lower predictability, simulation cannot replace measurements and can also not be used as an evidence.
- Wind and temperature data are calculated with the average altitude of the grid cell. Therefore, the temperatures for mountains and coasts can be a somewhat different from the data at the exact location which you have selected. You can find the altitude of the grid cell besides the coordinates.
- The "15-day" diagram shows hourly data. For one month, there are daily aggregations for minimum, maximum and average values. For more than 6 months there are monthly aggregations.
- We also offer raw data for sale. Please contact us for more information ([email protected])
Os dados meteorológicos históricos por hora desde 1940 para Thābit podem ser adquiridos com history+. Baixe variáveis como a temperatura, o vento, as nuvens e a precipitação como CSV para qualquer local na Terra.