Precipitation radar for Spain, Portugal and the Canary Islands

The precipitation radar of the Iberic Peninsula offers a precise visualization of rain for the last 90 minutes, based on the latest radar observations. So you can see if any thunderstorms are heading your way or whether you need your umbrella. Furthermore, the radar map shows the currently observed temperatures and wind speeds. These helpful function is now available for all locations in Spain including the Canary Islands and most of Portugal.
Simply choose a location in Spain and you can see the radar map by scrolling-down our Homepage or Current weather.
Improved precipitation forecast

Precipitation is one of the weather variables with the highest public interest, as it affects all kinds of commercial or private activities. Concurrently it is very challenging to predict the right timing of precipitation at a specific location. That inaccurate precipitation forecasts often have the effect of wet clothes, means it is also often-cited trigger for our users complaints. Therefore meteoblue recently introduced an improved precipitation scheme and a new visualization of the daily precipitation distribution. This accomplishes other popular features like the rainSPOT and radar forecast or the satellite cloud cover of the last 2 hours. If you wonder how precipitation probability is calculated, we recommend a look at the multimodel forecast, that compares the precipitation forecast of various weather models.
The sky is the limit?

High
spatial resolution works for better weather data - but does it also work in the office? We tried and found: less than 5 sqm per employee does no longer improve results.
So, we needed a new office … in crowded Basel... and finally found one - just across the street.
But (like raw weather model data) it needed improvement.
And we wanted to give it a new - meteoblue - face. This meant : do it ourselves!
So, we expanded our skills to
tearing out carpets and wires, filling holes, cleaning rubble. Then, painting walls (up to the ceiling), laying the floor and high performance connections. Next steps are to put in a great new infrastructure and working environment, decoration and creative spaces and finally, the most important ingredient: a
very dynamic team.
We enjoyed the work, the results and teaming up together, and really look forward to starting our
bluespace project.

meteoblue presents scientific papers at photovoltaic symposium

Solar energy applications, like solar-thermal systems providing heating energy or photovoltaic (PV) electricity generators need high precision weather data for Site Search, System Design, Monitoring and Operation. To improve the data quality and services meteoblue is constantly investing in research. Last year, one of our research focuses was on radiation variability and application of long term time series to classify local climatology. Its latest outcomes were two peer reviewed papers presented at the 32. symposium for photovoltaic solar energy in Bad Staffelstein, Germany.
How far is the next weather station?
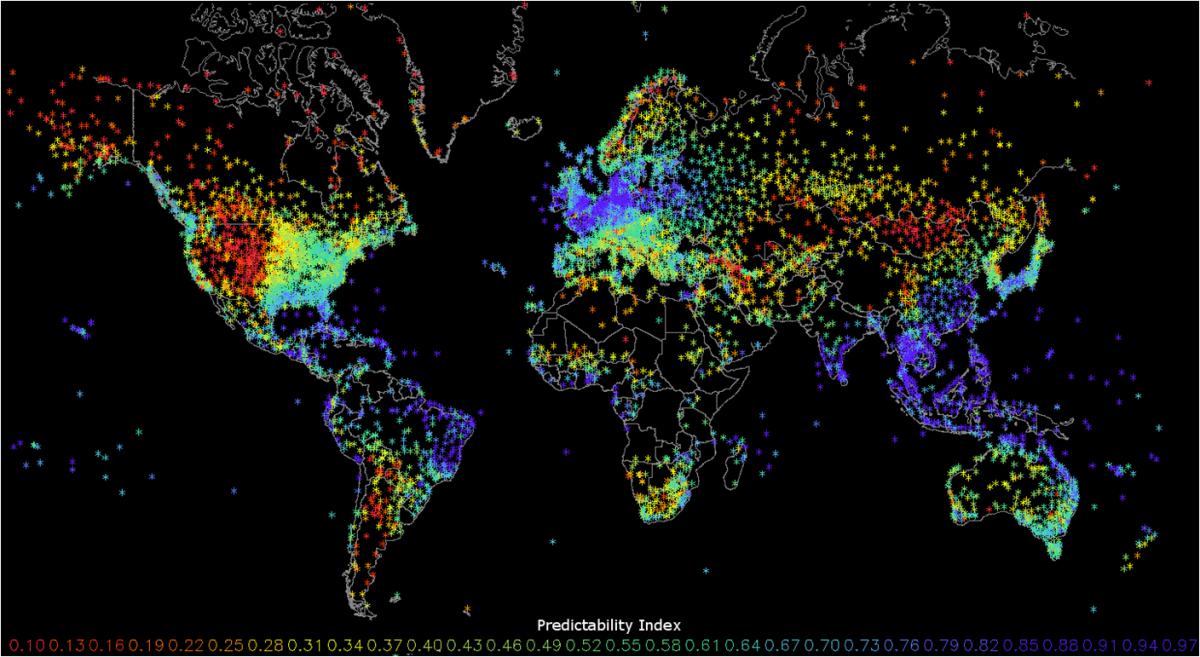
meteoblue simulations have been validated at more than 9'000 weather stations worldwide to prove the globally consistent quality of meteoblue forecast models. With nowcasting methods, the data of about 50'000 weather stations is used to locally improve the simulations in near real time. A few of them are available for short term verification, where you can see the differences of the last days forecast and the measurements. You can also do a climate comparison of the next available station with the actual forecast.
