Data privacy and adherence to regulation is important to us as part of a high quality service. Therefore, we have updated our Privacy statement to comply with the new European General Data Protection Regulation (GDPR) which goes into effect on 25 May 2018.
We have also updated our Terms & Conditions.

For further questions, please
click here.
The new Meteogram Air Quality includes the following diagrams:
- Air quality index (CAQI)
- Particulates: PM2,5 and PM10, desert dust concentration
- Gases: NO2, SO2, ozone concentration
- Pollen (grass, birch, olive - in Europe)
The air quality forecasts are available for the next 4 to 6 days (depending on variable). Variables available globally are air quality index, particulates and gases. The air pollution is displayed in different colors from green (low load) to red (heavy load).
The spatial representation of the air quality can be found in the meteoblue weather maps in the category "
Air quality".
More information on the individual variables of air quality and their importance for health can be found on our
help pages.
We thank our data sources, hope that the information helps you to find the best air and that transparency supports the future quest for clean air.
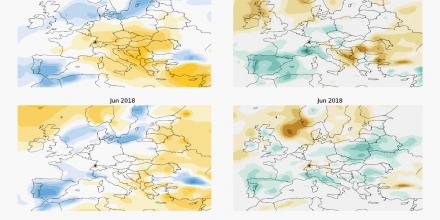
The new Seasonal climate forecast provides a seasonal outlook at temperature and precipitation monthly mean anomalies for the selected region (100km x 100km) for the next 6 months. It indicates the variation from the monthly mean, without predicting any particular weather conditions on a particular day in the forecast period.
A month with negative anomaly of -1 degree means that some days have significantly colder hours than the average. However, it is very unlikely that every hour of this month is 1 degree colder.
To better understand how quickly the seasonal forecast is changing, new forecasts for the next 6 months are computed every day. We compute the seasonal forecast, by averaging all computed forecasts from different sources within a ten-day period, giving three periods of different forecasts calculated during the last 30 days (namely the average of all forecasts from days 0-10, 10-20 and 20-30).
More information on our new Seasonal forecast can be found below the graphic.
The new Meteogram Air Quality includes the following diagrams:
- Air quality index (CAQI)
- Particulates: PM2,5 and PM10, desert dust concentration
- Gases: NO2, SO2, ozone concentration
- Pollen (grass, birch, olive - in Europe)
The air quality forecasts are available for the next 4 to 6 days (depending on variable). Variables available globally are air quality index, particulates and gases. The air pollution is displayed in different colors from green (low load) to red (heavy load).
The spatial representation of the air quality can be found in the meteoblue weather maps in the category "
Air quality".
More information on the individual variables of air quality and their importance for health can be found on our
help pages.
We thank our data sources, hope that the information helps you to find the best air and that transparency supports the future quest for clean air.
Forecasts are good - if they are accurate. We checked it out for our annual ski ⛷day: could we give it a go for 31.01., the only day that most of us could make - 5-days ahead?

We got 100%
forecast accuracy, 33% new cross-country skiers ☺ and 20% of us without crashes ☹ - enough to cure our backs at work for more innovations. Thanks for watching us!


