Some of our users probably already noticed that we have updated the design of our 14 days weather forecast, which is now clearer to read and loading faster than any other chart.
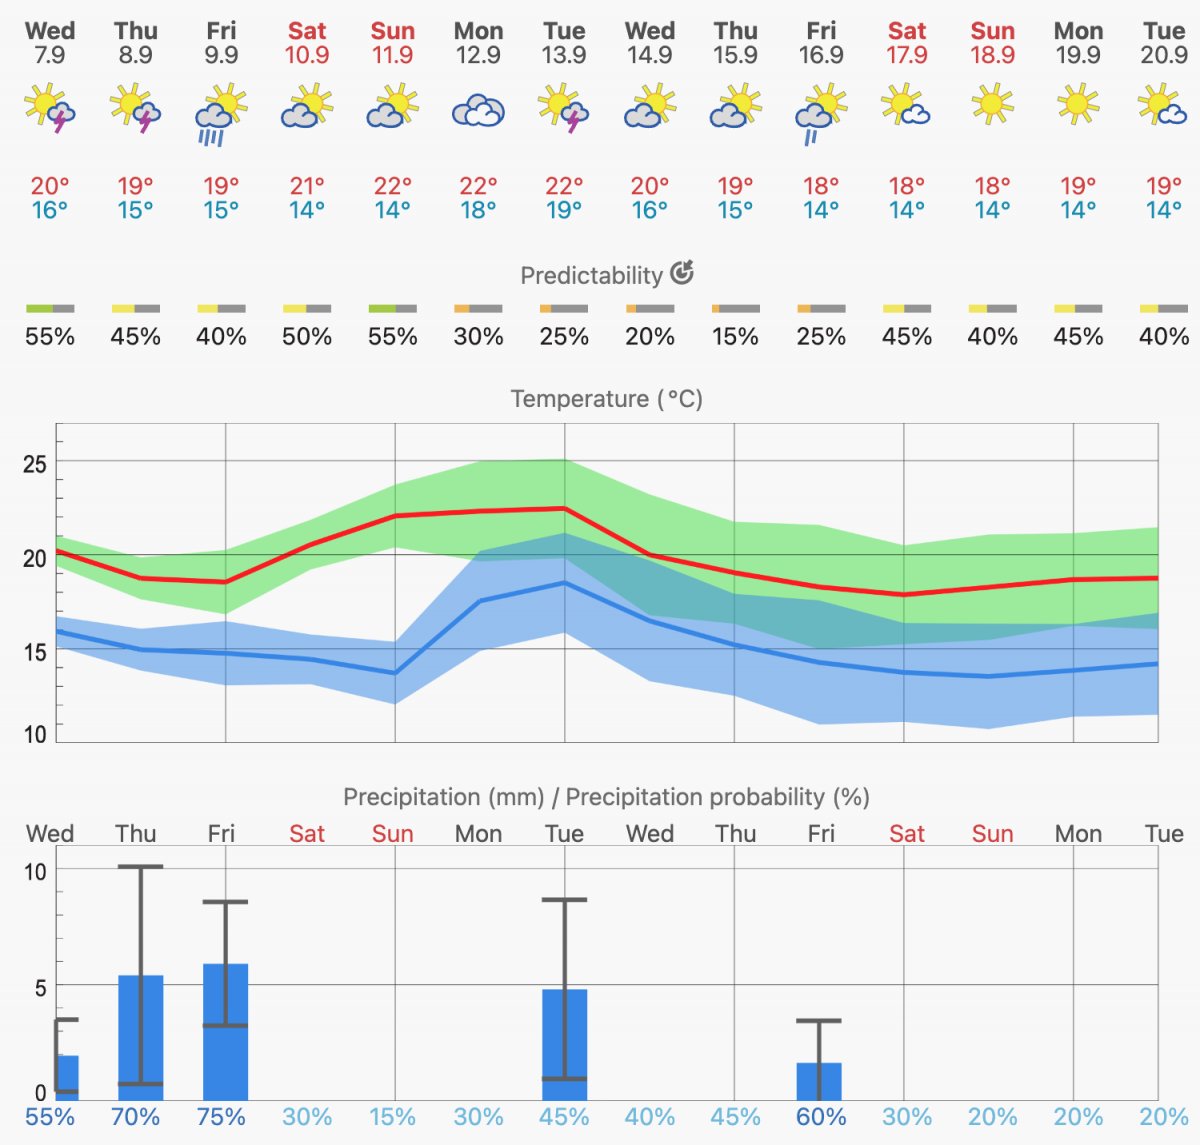
The 14 days forecast is our most used special diagram. It summarizes the forecast of the essential weather variables for the next 14 days. The first part of the diagrams displays the weather pictograms and the expected minimum and maximum temperature of a particular day.
In the second part of the chart, the predictability of the forecast is indicated, which is of great importance for such a long forecasting time range, because the longer the forecast range, the more complex the prediction of a precise forecast. Since the variablity depends on the expected weather conditions (e.g. high vs. low pressure) and the region (e.g. desert vs coastal area), the predictability varies from location to location and from daay to day and is an important tool for interpreting the forecast data. You can also download the meteogram as PNG image.
Furthermore, the 14 days forecast shows the expected range of possible temperatures and precipitation amounts.
For those who want to print the meteogram, the "Download" button produces a nice png image which can be saved on your device.
We suggest using
the following features for advanced information on the 14-day weather forecast. All of those features are part of
our point+ website subscription:
- The MultiModel Ensemble forecast showing the different model ensembles is, therefore, an excellent tool to better understand the likelihood of the forecast data.
- Hourly 14 days forecast shows the variations of temperature, precipitation, cloud cover and wind over the day.
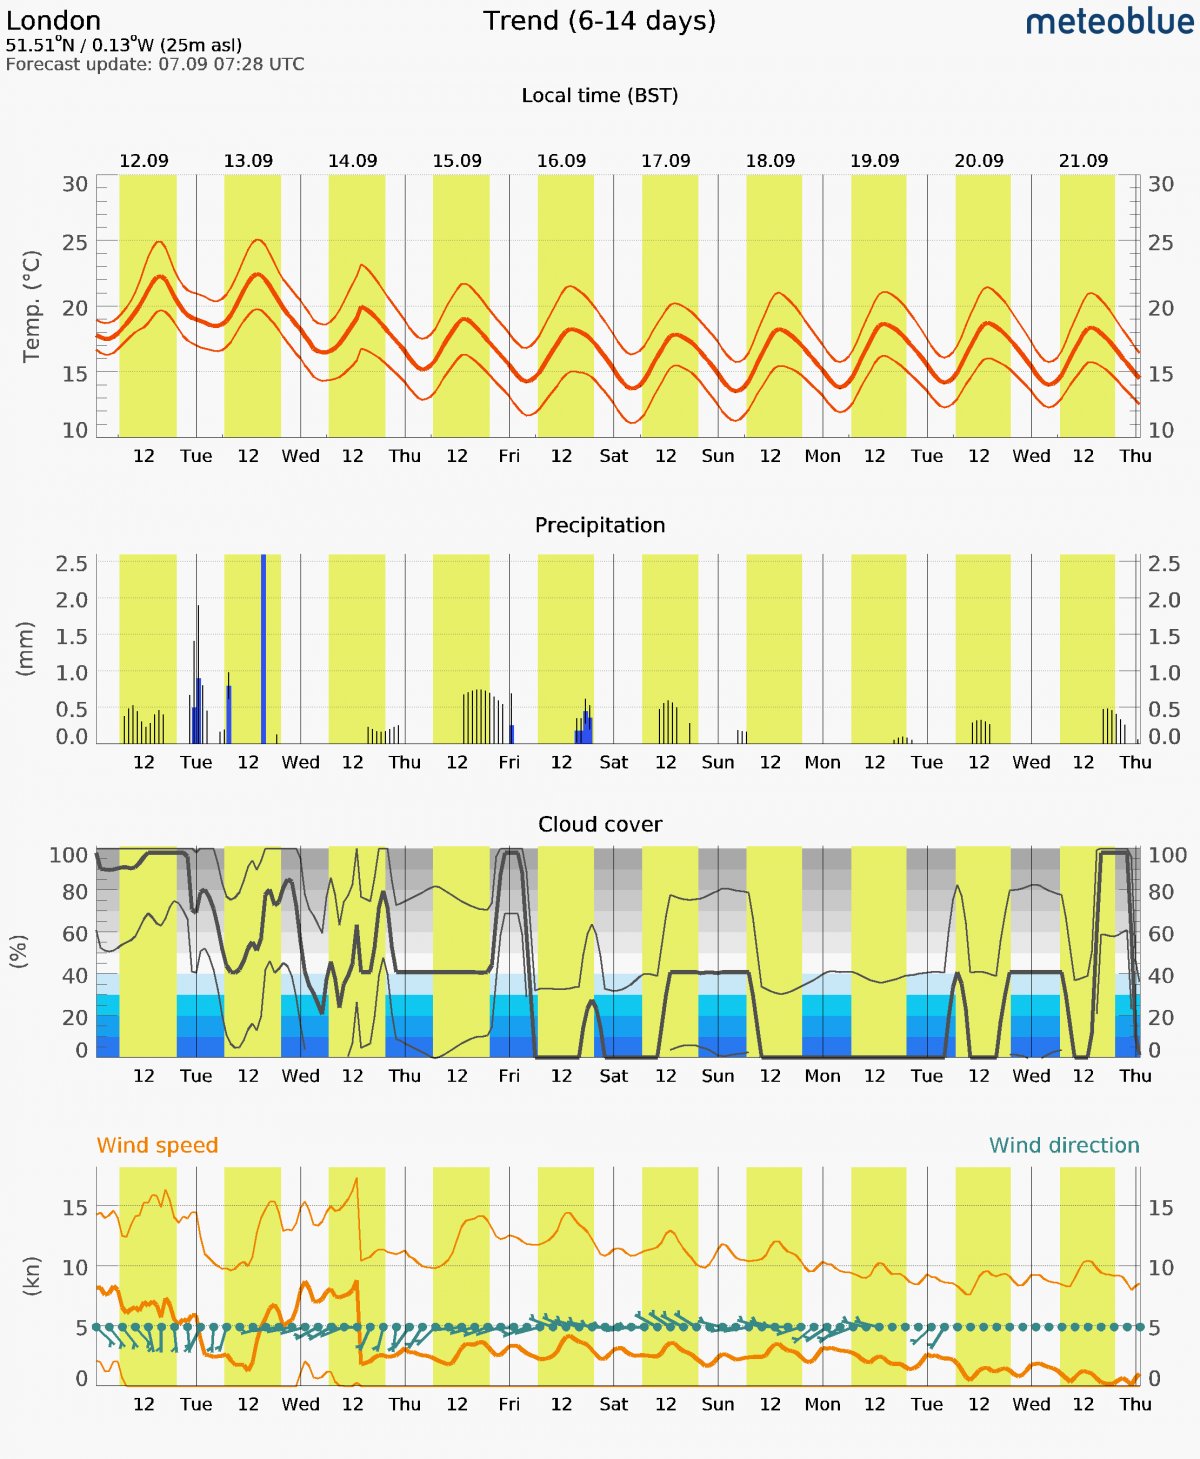
- Our detailed graph for the forecast days 6 to 14 enables a better overview of the abovementioned weather variables.
Since these are advanced diagrams, we also have detailed descriptions directly below the meteograms or on our designated help pages.


We hope you appreciate the new design of our 14 days weather forecast and are happy if you send us your suggestion or questions.
