point+
Más opciones para este meteograma están disponibles a través del point+
Aprenda más

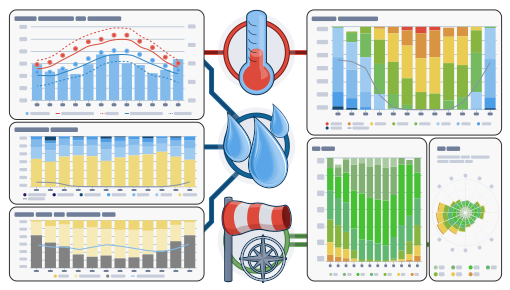
La archivo de simulación historico proporciona acceso a simulaciones climáticas para cualquier lugar en el mundo. Usted puede ver información sobre el tiempo de ayer o la historia meteorológica de los últimos años. Los diagramas del archivo meteorológico se dividen en tres gráficos:
- Temperatura, incluyendo la humedad relativa en intervalos de una hora
- Nubes (fondo gris) y cielo claro (fondo amarillo). Cuanto más oscuro es el fondo gris, es más densa la cubierta de nubes
- Velocidad y dirección del viento (en grados desde 0° = Norte, 90° = Este, 180° = Sur y 270° = Oeste). En el meteograma del archivo histórico, los puntos morados representan la dirección del viento, como se muestra en el eje derecho.
Please consider the following:
- The weather archive shows simulation data, not measured data, for the selected area.
- The data is not compared to measured data of a weather station (because in more than 99% of the places on Earth, no measurements are available). Simulation data with high predictability can replace measurements. For areas or data with lower predictability, simulation cannot replace measurements and can also not be used as an evidence.
- Wind and temperature data are calculated with the average altitude of the grid cell. Therefore, the temperatures for mountains and coasts can be a somewhat different from the data at the exact location which you have selected. You can find the altitude of the grid cell besides the coordinates.
- The "15-day" diagram shows hourly data. For one month, there are daily aggregations for minimum, maximum and average values. For more than 6 months there are monthly aggregations.
- We also offer raw data for sale. Please contact us for more information ([email protected])
Los datos meteorológicos históricos por hora desde 1940 para Daniel pueden adquirirse con history+. Descarga variables como temperatura, viento, nubes y precipitaciones en formato CSV para cualquier lugar de la Tierra.