
history+ offers consistent weather simulation data in hourly resolution since 1979. Archived weather simulations are assembled to continuous time series. Historical data are the first step to correlate past events and optimize your current and future business.
Weather variables, such as temperature, wind, cloud cover, precipitation, and many others can be downloaded in hourly or daily resolution as CSV and Excel. The datasets are also explorable online for any place worldwide.
Currently the history+ interface includes a year comparison, histogram, wind rose and risk assessment with some modifications and has now implemented some new features.
In the past, we have doubled the data range by adding ERA5 data, in addition to our global and local models, so 2-3 different models were available for comparison as a worldwide unique offer.
In the next weeks, we will re-arrange the download section and add additionally to the ERA5 reanalysis model the ERA5T model.
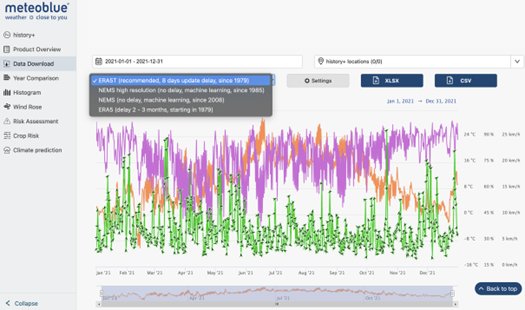
ERA5T downloading interface:
By then, you can directly select between the low- and high-resolution model and the
ERA5 and ERA5T reanalysis models for your desired location. In general, the two reanalysis models slightly differ in
their grid cells and therefore in the data output. The major difference between these two is the fact, that ERA5 had
a time delay of approximately 3 months whereas ERA5T needs only around one week to be filled up. This improves the
analysis of time series which are only a short time in the past because reanalysis datasets utilize archived
satellite observations and weather station measurements in combination with weather models to provide a globally
consistent dataset.
Risk assessment
Some months ago, we also updated the risk assessment.
The original risk assessment analysed different events like
Cold and warm events: Temperature
is below or above a certain threshold for a certain time.
Precipitation: Probability of mm/week.
Water capacity: Approximated soil water content.
Cloud cover: Periods with cover below a certain threshold.
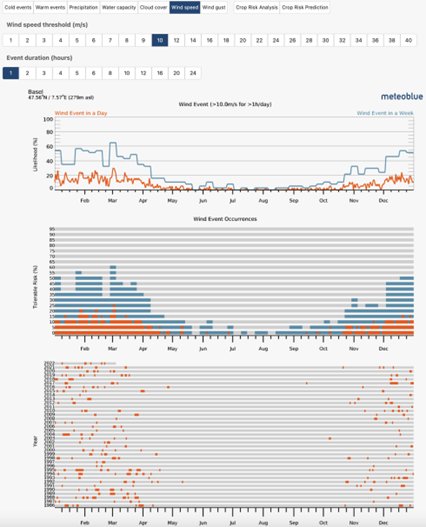
Since some time, it also summarizes the probabilities of user-defined wind speed and gust events. The summaries are
based on more than 35 years of simulated historical weather data and thus facilitate long-term analyses, providing
advantages like customized assessment by user-defined event wind speed thresholds and event durations or the
probabilities for user-defined wind events over one-year periods, which helps to find seasonal patterns.
Crop risk
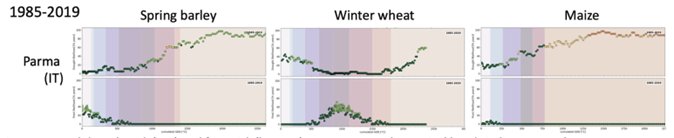
The meteoblue local crop risk diagrams are a novel way to combine climate data, weather data, and crop data to assess local crop-specific climate risks based on weather event frequency. Since some months, this feature is also part of history+ and is quick-to-read, available for several crops and risks and delivers a 7-day seasonal soil water forecast.
Agricultural production is largely determined by weather conditions during the crop growing season. An important aspect of crop yield estimation concerns crop growth development. The occurrence of meteorological events such as frosts, droughts, or heat stress during a crop’s phenological stages helps to explain yield fluctuations. We developed a methodology and visualization tool for risk assessment and tested the workflow for drought and frost risk for winter wheat, winter barley and grain maize in Belgium. The methodology has the potential to be extended to other extreme weather events and their impacts on crop growth in different regions of the world.
In addition to analysing crop climate risk by looking at back, it is also possible to assess local in-season crop weather risk by looking forward.

Climate predictions
Severe heat waves hit large parts of Europe in the last weeks. Moreover, scientific experts agree that the ongoing anthropogenic climate change exacerbates this problem. This raises the question of how the temperatures will increase in the near (and more distant) future and how the climate will change by the end of the 21st century.
To better understand this development, we have developed climate predictions, a climate forecast tool based on the results used in the IPCC reports.
The climate predictions are available for four "emission scenarios", also called "Representative Concentration Pathways" (RCP). RCP2.6, RCP4.5, RCP6.0 and RCP8.5 are the standard scenarios, whereas RCP2.6 is the most optimistic and RCP8.5 is the most alarming. However, scientists agree that under the current development, the most likely emission scenario lies between RCP6.0 and RCP8.5.
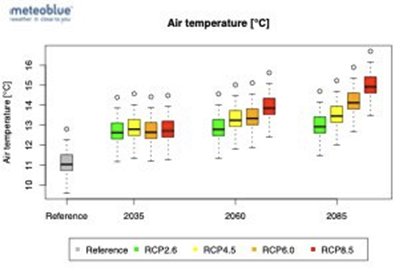
The figure shows air temperatures (°C) for those four emission scenarios and four time periods: Reference (1979 - 2019), 2020 - 2049, 2045 - 2074, and 2070 - 2099. The variability in the boxplots of each diagram represents the interannual variability (likely differences between years) within the chosen time period and indicates typical and extreme years. In the near future, the mean annual air temperature will be nearly identical for all four emission scenarios. However, towards the end of the century, mean air temperatures in the RCP8.5 scenario are around 2 degrees Celsius warmer than in the RCP2.6 scenario.
This analysis is also available for other parameters such as frost days, ice days, tropical nights, summer days, heat days, average precipitation amount, heavy precipitation events and many more. It is possible to analyse these parameters on an annual or even monthly basis.
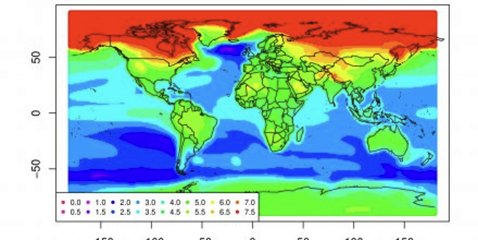
We also offer customized climate prediction solutions such as maps for temperature anomalies for more detailed insight.
Furthermore, we also have some climate features on our website that analyse the development of the climate based on consistent historical time series such as the climate diagrams or the climate change diagrams. These features can be freely accessed via the meteoblue website.
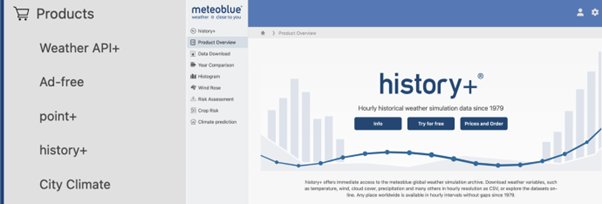
Beside all content updates, we have also improved the navigation of history+. Starting from the home page, the history+ section is now available in the products section. This will improve the overview of all website services since they are all available in this section.
You can test history+ without a subscription and explore the endless possibilities of historical weather data. The free test is available for Basel, Switzerland.
If you want to purchase history+, the net price for Access is 100 € for 1 location and 700 € for 10 locations.
We hope you enjoy history+ and the new functions and appreciate your feedback!
