In the pre-satellite era, meteorologists had to work with limited data gathered via ships, weather stations, and weather balloons. Much of the world's oceans, where most hurricanes form, went unobserved. This changed with the launch of the first weather satellite in 1960, which sent back the first-ever images of Earth's cloud systems. Today, an entire constellation of satellites orbits our planet, providing continuous data that underpin nearly every weather forecast and climate analysis.
Modern weather monitoring primarily depends on two types of satellites:
- Geostationary satellites orbit high above the equator and constantly observe the same region of Earth, capturing new images every few minutes. Their continuous view is essential for tracking rapidly developing storms.
- Polar-orbiting satellites fly closer to Earth, circling from pole to pole and scanning the entire planet several times a day. These deliver high-resolution global data, which feed into weather prediction models and climate monitoring systems.
Satellites carry advanced instruments that detect various forms of electromagnetic radiation, including visible, infrared, and microwave wavelengths:
- Visible imagers show the cloud tops and the structure of hurricanes as we would see them from space.
- Infrared sensors measure the temperature of cloud tops and sea surfaces, allowing meteorologists to estimate storm intensity, even at night.
- Microwave sensors penetrate thick clouds to reveal rainfall, wind speed, and ocean surface conditions beneath.
- Radar instruments map flooding and track wave heights.
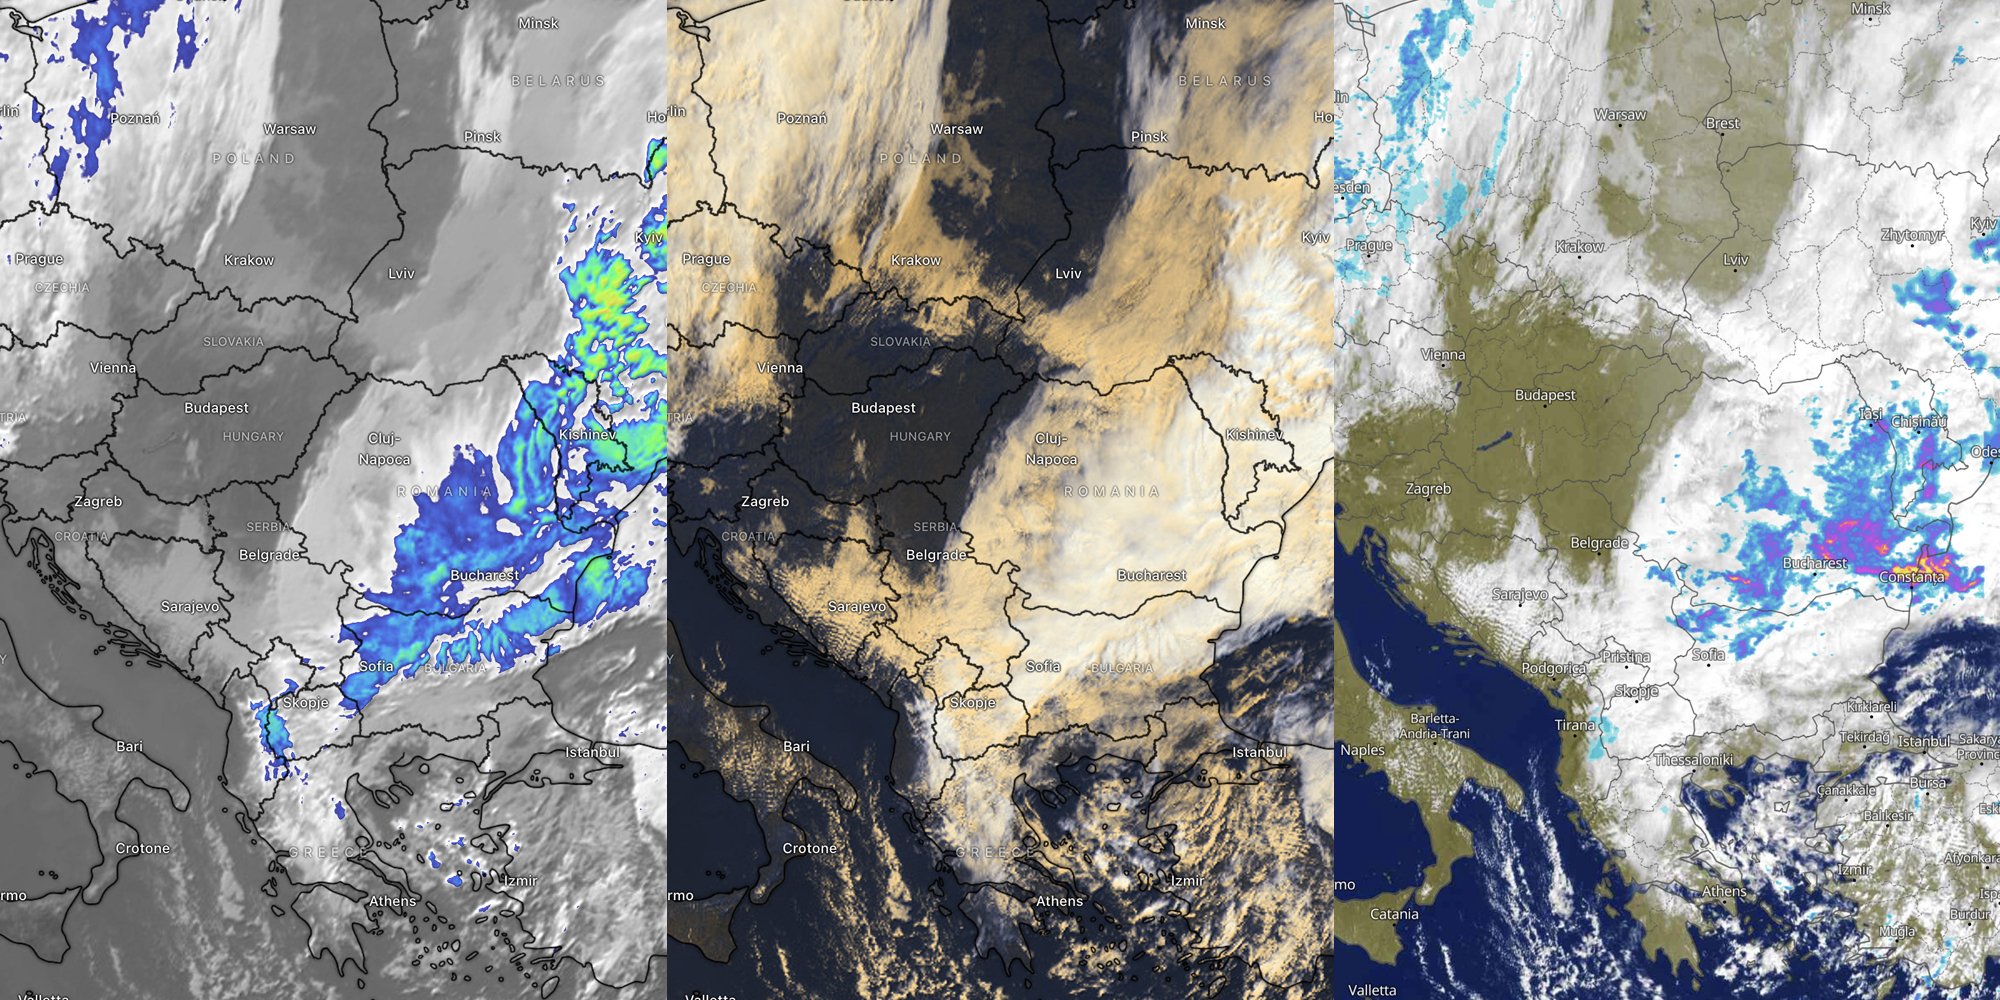
Left: Raw infrared image with applied colour-map (Windy.com), Centre: Post-processed combination of visual and infrared channels (Windy.com), Right: Composite of visible and infrared channels overlaid with radar data (meteoblue.com)
Together, they create a complete, multi-layered picture of a storm's development and potential impact, making early detection and disaster response far more effective than it used to be.
When a hurricane begins to form over warm tropical waters, satellites monitor changes in wind patterns, temperature, and cloud formation. As the storm intensifies, they track its eye and estimate wind speeds, what helps to forecast its path. During landfall, satellites provide near real-time updates for emergency services, and in the aftermath, they help map flooded regions, assess infrastructure damage, and support recovery efforts.
Some of the most powerful and devastating hurricanes in recent history were tracked from space: In 2015, Hurricane Patricia became the most intense hurricane ever recorded in the Western Hemisphere, with winds reaching 346 km/h. Satellite data allowed forecasters to monitor Patricia's rapid intensification in real time, providing warnings before landfall. Similarly, in 2024, Hurricane Milton intensified from a tropical depression to a Category 5 storm in less than 49 hours – the fastest on record in the Atlantic. Meteorological satellites captured bursts of lightning inside the hurricane's eye, helping scientists understand how lightning activity signals rapid storm strengthening.
More recently, Super Typhoon Ragasa (2025) in the Western Pacific reached Category 5 intensity, with winds exceeding 300 km/h. Geostationary satellites continuously observed the typhoon's eye structure, convective bursts, and rapid changes in intensity, while polar-orbiting satellites provided detailed temperature, humidity, and precipitation data. These combined observations helped forecasters issue timely warnings and improve track predictions.
To see these observations in action, meteoblue offers a global composite of high-resolution satellite and radar imagery. In Europe, satellite images are updated every fifteen minutes, showing cloud movement, precipitation, and atmospheric activity in real time. The meteoblue satellite visualisations are created using data from GOES-19, GOES-18, Himawari-9, and EUMETSAT's Meteosat and MTG satellites. These satellites deliver images in the visible light (0.6 μm) and infrared (10.8 μm) spectral bands, providing complementary information about cloud structure, temperature, and storm development. The raw data from the separate satellites are co-registered and seamlessly mosaicked to correct minute differences between the images. The data are then calibrated and processed into single-band grayscale images, which are finally blended, enhancing contrast, adjusting for sunlight and sharpening fine details to create realistic, high-contrast imagery of global weather systems.
See it for yourself and explore cloud movements, storms, and other weather phenomena in real time with the meteoblue high-resolution satellite imagery.
