The climate of our cities is changing, and with it, the way we manage urban life. As heatwaves become more frequent and cities continue to grow, precise, forward-looking temperature data is essential for maintaining a high quality of life. At meteoblue, we are meeting this challenge by integrating high-resolution forecasting tools directly into our public platforms, providing a clearer picture of how heat moves through the streets we live in.
The 6-Hour Leap: Planning for the Immediate Future
Until now, our public Urban Temperature Maps provided a nowcast – a high-precision look at the temperature during the current hour. While monitoring the "now" is vital, cities are dynamic environments where building density, asphalt, and green spaces create heat patterns that shift by the minute. We are pleased to announce that all Urban Temperature Maps on the meteoblue website have been upgraded to include a 6-hour forecast. This allows users to not only see real-time heat but to anticipate how those temperatures will evolve across specific neighbourhoods over the coming hours. For professional planning needs, our internal systems can even provide detailed urban temperature forecasts for up to 7 days upon request.
Understanding the Tech Lingo: Nowcast vs. Forecast
To get the most out of these maps, it helps to understand the two different "modes" of data we provide. The nowcast serves as a real-time snapshot, utilising a network of local IoT sensors and satellite data to show exactly what is happening at the current moment. In contrast, the forecast acts as a predictive model, using advanced numerical weather prediction models to calculate future conditions. The new 6-hour forecast bridges the gap between the current moment and the near future, helping you stay ahead of rising temperatures.
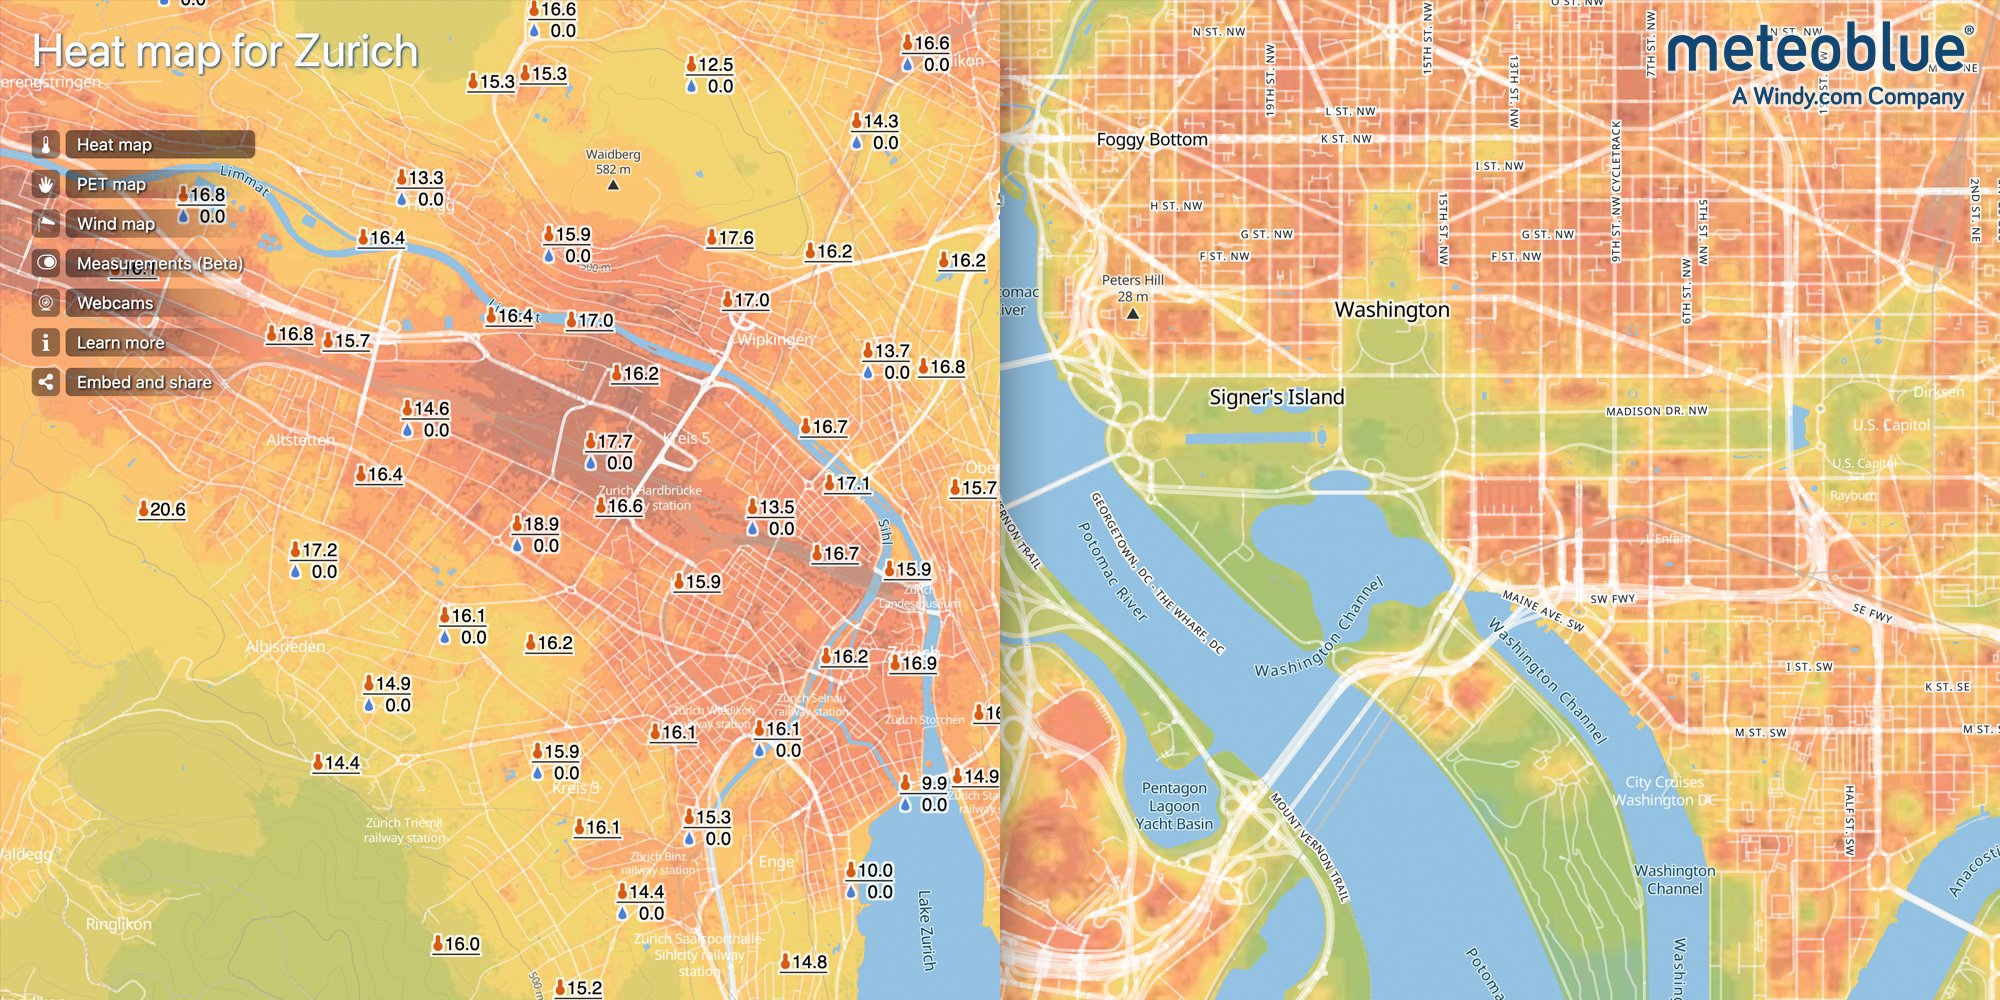
Hyperlocal Data at a 10-Metre Scale
What sets these maps apart is their 10-metre spatial resolution, which uses advanced downscaling techniques to deliver insights at a neighbourhood scale rather than a city-wide average. This level of detail is critical for public health, as authorities can monitor heat stress in real-time to protect vulnerable populations. Similarly, architects and city officials can use this data to design effective climate adaptation strategies, such as the creation of "cool islands".
Beyond planning, this data supports energy and infrastructure management by helping utility providers better forecast cooling demand and manage risks to transport networks. It also plays a vital role in event planning, allowing organisers to make informed, location-specific decisions to ensure the safety of attendees during outdoor events.
We invite you to explore these enhanced maps directly on our website to see how these tools provide the clarity needed to navigate a warming world with confidence.
