
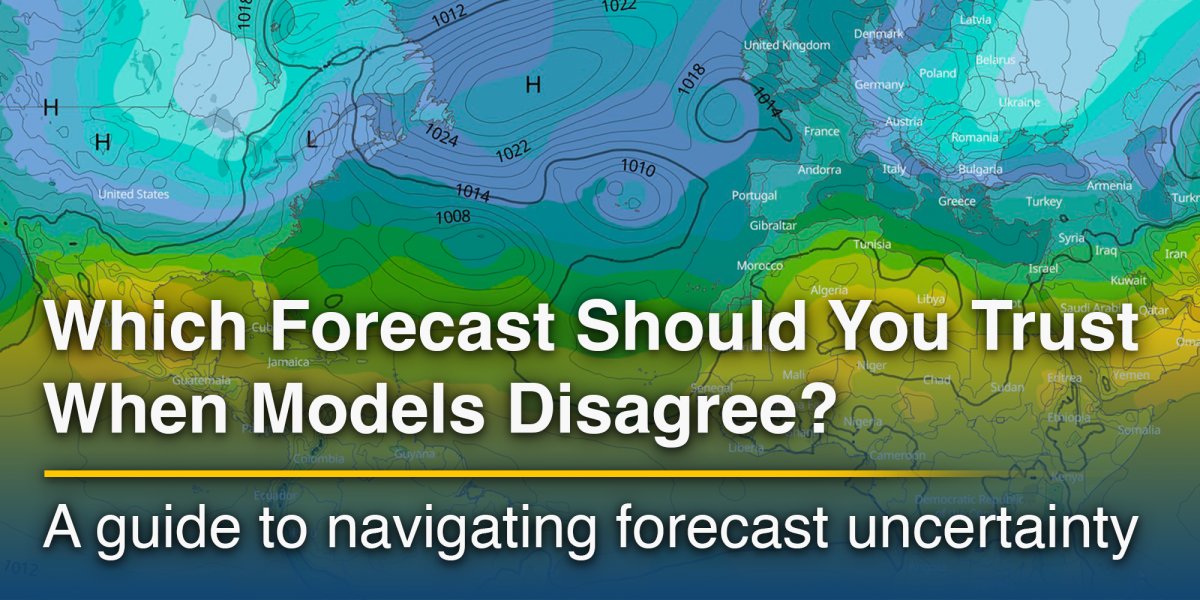
Forecast disagreement is not unusual. Nor is it a sign that forecasting has failed. It reflects the complexity of the atmosphere, as well as the variety in methods by which numerical weather prediction models describe it.
Weather models are built to simulate atmospheric processes using physical equations and large amounts of observational data. But none of them starts with a perfect picture of the atmosphere. Observations come from weather stations, satellites, radar, aircraft and other sources, yet it is impossible to measure every point in the atmosphere at the same time. Each model therefore begins with a slightly incomplete and differently processed version of reality.
From this point onwards, the gap widens. Models differ in resolution, physical assumptions and the means used to represent processes such as turbulence, clouds, radiation or convection. A global model may capture large-scale pressure systems very well, while a high-resolution regional model may describe local wind patterns or convective showers in more detail. This does not automatically make one model "good" and another "bad". Their performance depends on the region, the forecast horizon and the type of weather situation.
This is why model disagreement is often most visible during fast-changing or high-impact weather. Strong wind events, thunderstorms, rapid cyclogenesis or heavy precipitation are sensitive to small changes in timing, temperature, humidity and pressure. A difference of only a few hours in the movement of a front can strongly affect the forecast for one location.
Forecast uncertainty should therefore not be seen as a weakness. It is useful information. When several models show a similar development, confidence in the general scenario increases. When they diverge strongly, it is a signal that the situation is more uncertain and should be monitored more carefully. In operational meteorology, this uncertainty is not something to ignore; it is part of the forecast.
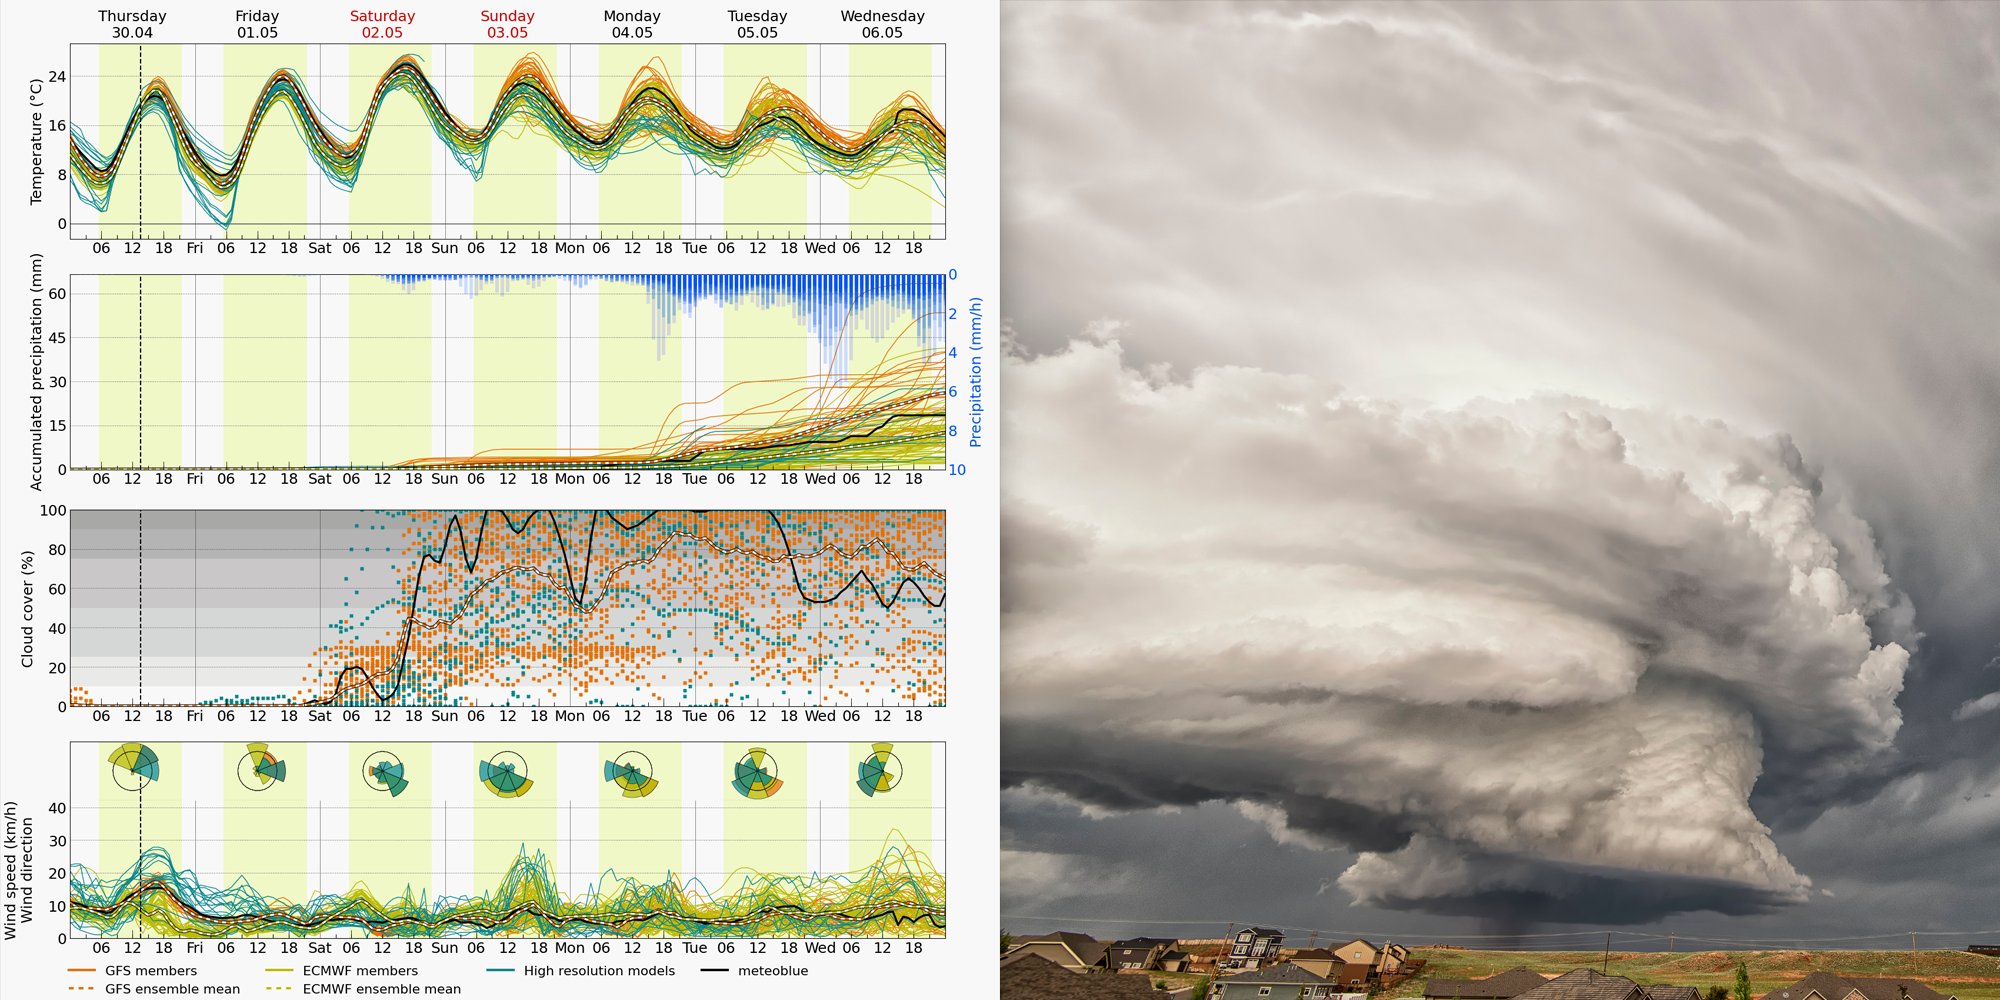
A common misunderstanding is that the forecast shown by most models must be the correct one. Consensus can be helpful, but it does not guarantee accuracy. Several raw models can share similar biases or miss the same local effect. At the same time, a forecast that looks different in a side-by-side comparison may be closer to reality if it has been calibrated for the specific location.
This is especially important because many publicly available forecast visualisations show raw model output on a grid. A model grid cell represents an area, not an exact point. The forecast may describe the broader atmospheric pattern well, but it is not necessarily optimised for a specific weather station, city district, wind farm, event venue or construction site. For many users, however, the weather at the exact location is what determines the value of the forecast.
The meteoblue Learning MultiModel, or mLM, was developed precisely to address this gap.
Rather than using one raw model as the final forecast, mLM combines information from multiple global and regional weather models, learns from historical forecast errors, integrates local measurement data where available, and applies machine-learning-based correction for a specific point location.
The result is a calibrated point forecast rather than a simple display of gridded model output. For variables such as temperature, dew point and wind speed, mLM evaluates how different models have performed in the past under comparable conditions and adapts the forecast accordingly. If a certain model regularly overestimates wind speed at a specific location, or another performs better under particular weather patterns, this information can be used to improve the forecast.
During extreme events, this approach becomes particularly valuable. Raw models may overestimate gusts, underestimate peak intensities, shift the timing of an event or disagree strongly with one another. mLM statistically evaluates these patterns and adjusts the forecast based on past performance and real observations.
So which forecast should you trust when models disagree?
The best answer is neither the model that looks most dramatic, nor the one that agrees with the majority. For practical use, the most useful forecast is usually the one that combines model diversity with local calibration and verification against measurements.
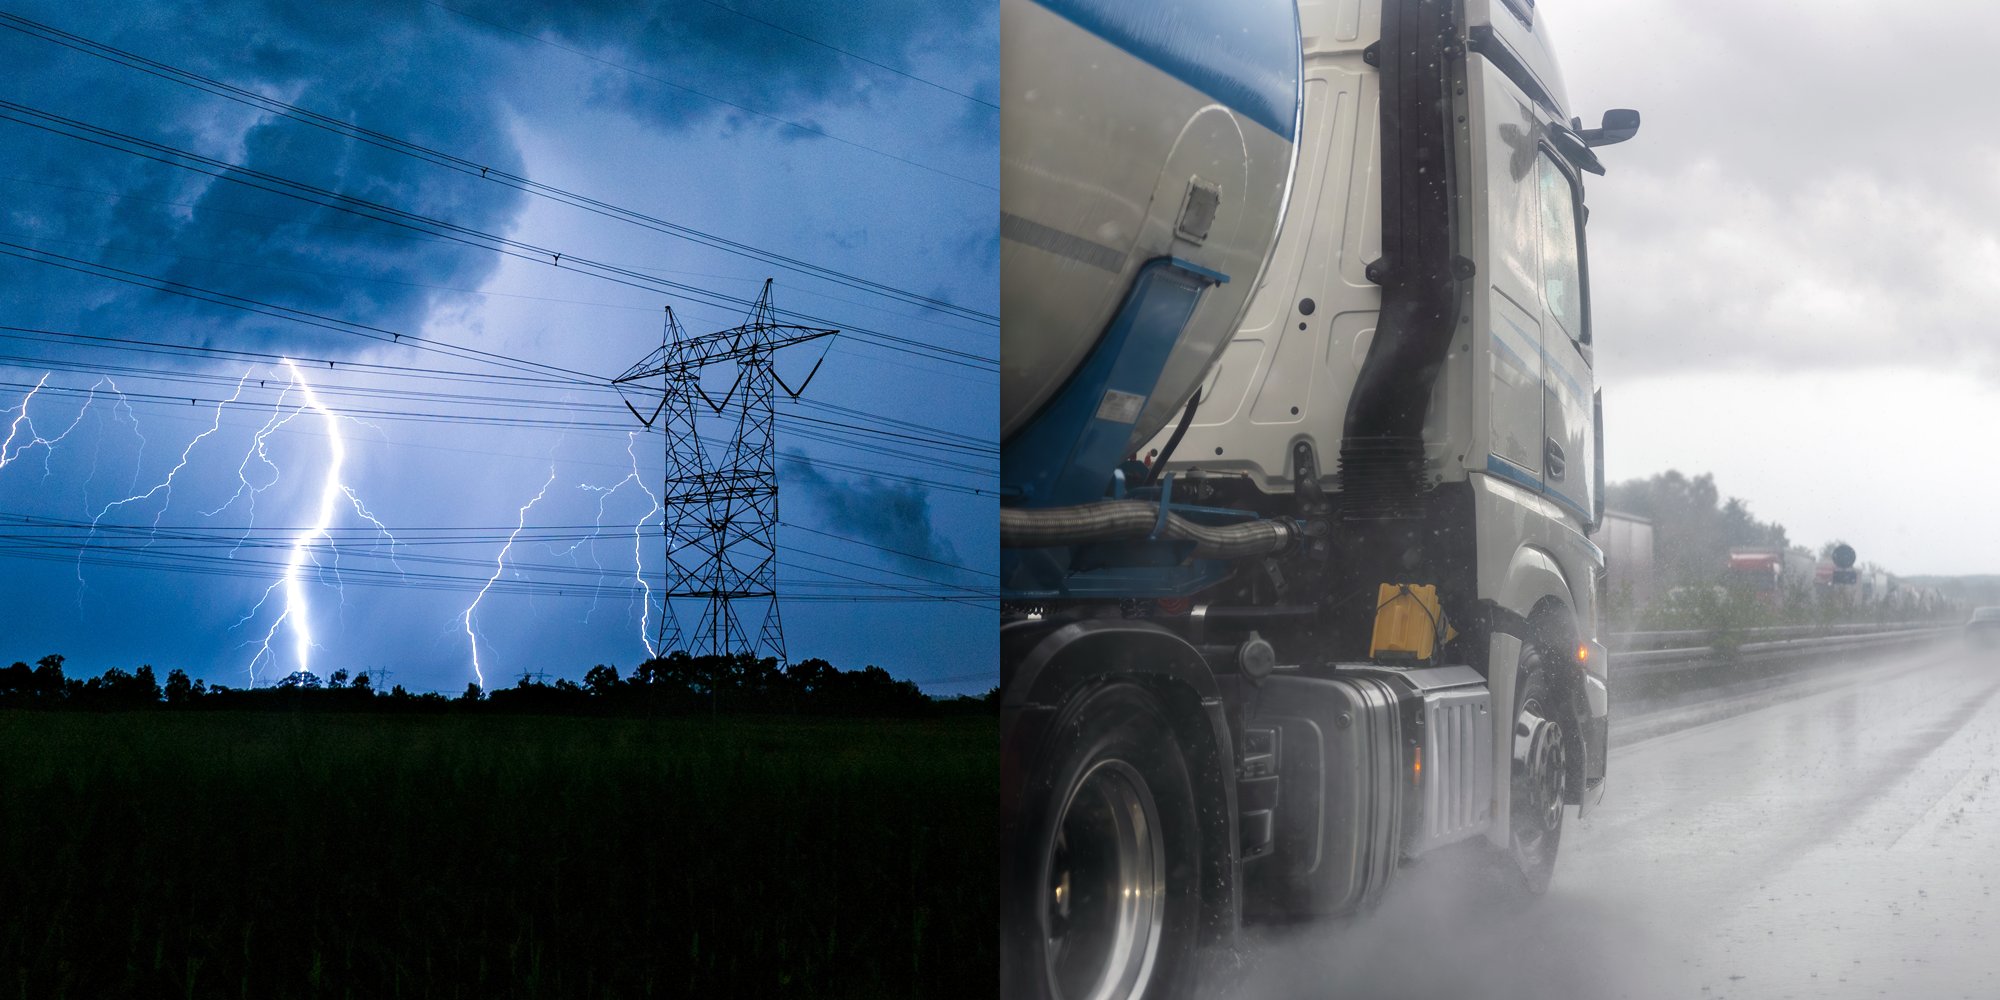
For weather-sensitive sectors such as aviation, energy, logistics, construction, events or agriculture, small forecast differences can have large consequences. A few metres per second in wind speed, a short shift in rainfall timing or a missed temperature threshold can affect planning, safety and operations. In these cases, local forecast accuracy is more important than visual agreement between raw model maps.
Modern forecasting is moving in this direction. Numerical weather prediction remains the foundation, but the next step is intelligent post-processing: combining several models, correcting systematic errors and using observations to improve local accuracy.
Forecast disagreement will not disappear, because the atmosphere will always contain uncertainty. Yet with the right methods, disagreement becomes easier to interpret. It shows the range of possible developments, helps assess confidence and supports better use of weather information.
In the end, the question is not simply “Which model is right?” A better question is “Which forecast has been tested, calibrated and adapted for the location and situation you care about?”
Want to explore this topic in more detail or share your questions? Join the dedicated discussion in the meteoblue Community Forum, where our experts and community members can exchange insights and continue the conversation.