history+® weather
archive data
Hourly historical weather simulation data since 1940
history+ offers immediate access to the meteoblue global weather simulation archive. Download weather variables, such as temperature, wind, cloud cover, precipitation and many others in hourly resolution as CSV, or explore the datasets online. Any place worldwide is available in hourly intervals without gaps since 1940.
Features
80+ years of historical data
history+ offers consistent weather simulation data in hourly resolution since 1940. Archived weather simulations are assembled to continuous time series. Historical data are the first step to correlate past events and optimize your current and future business.
Worldwide availability
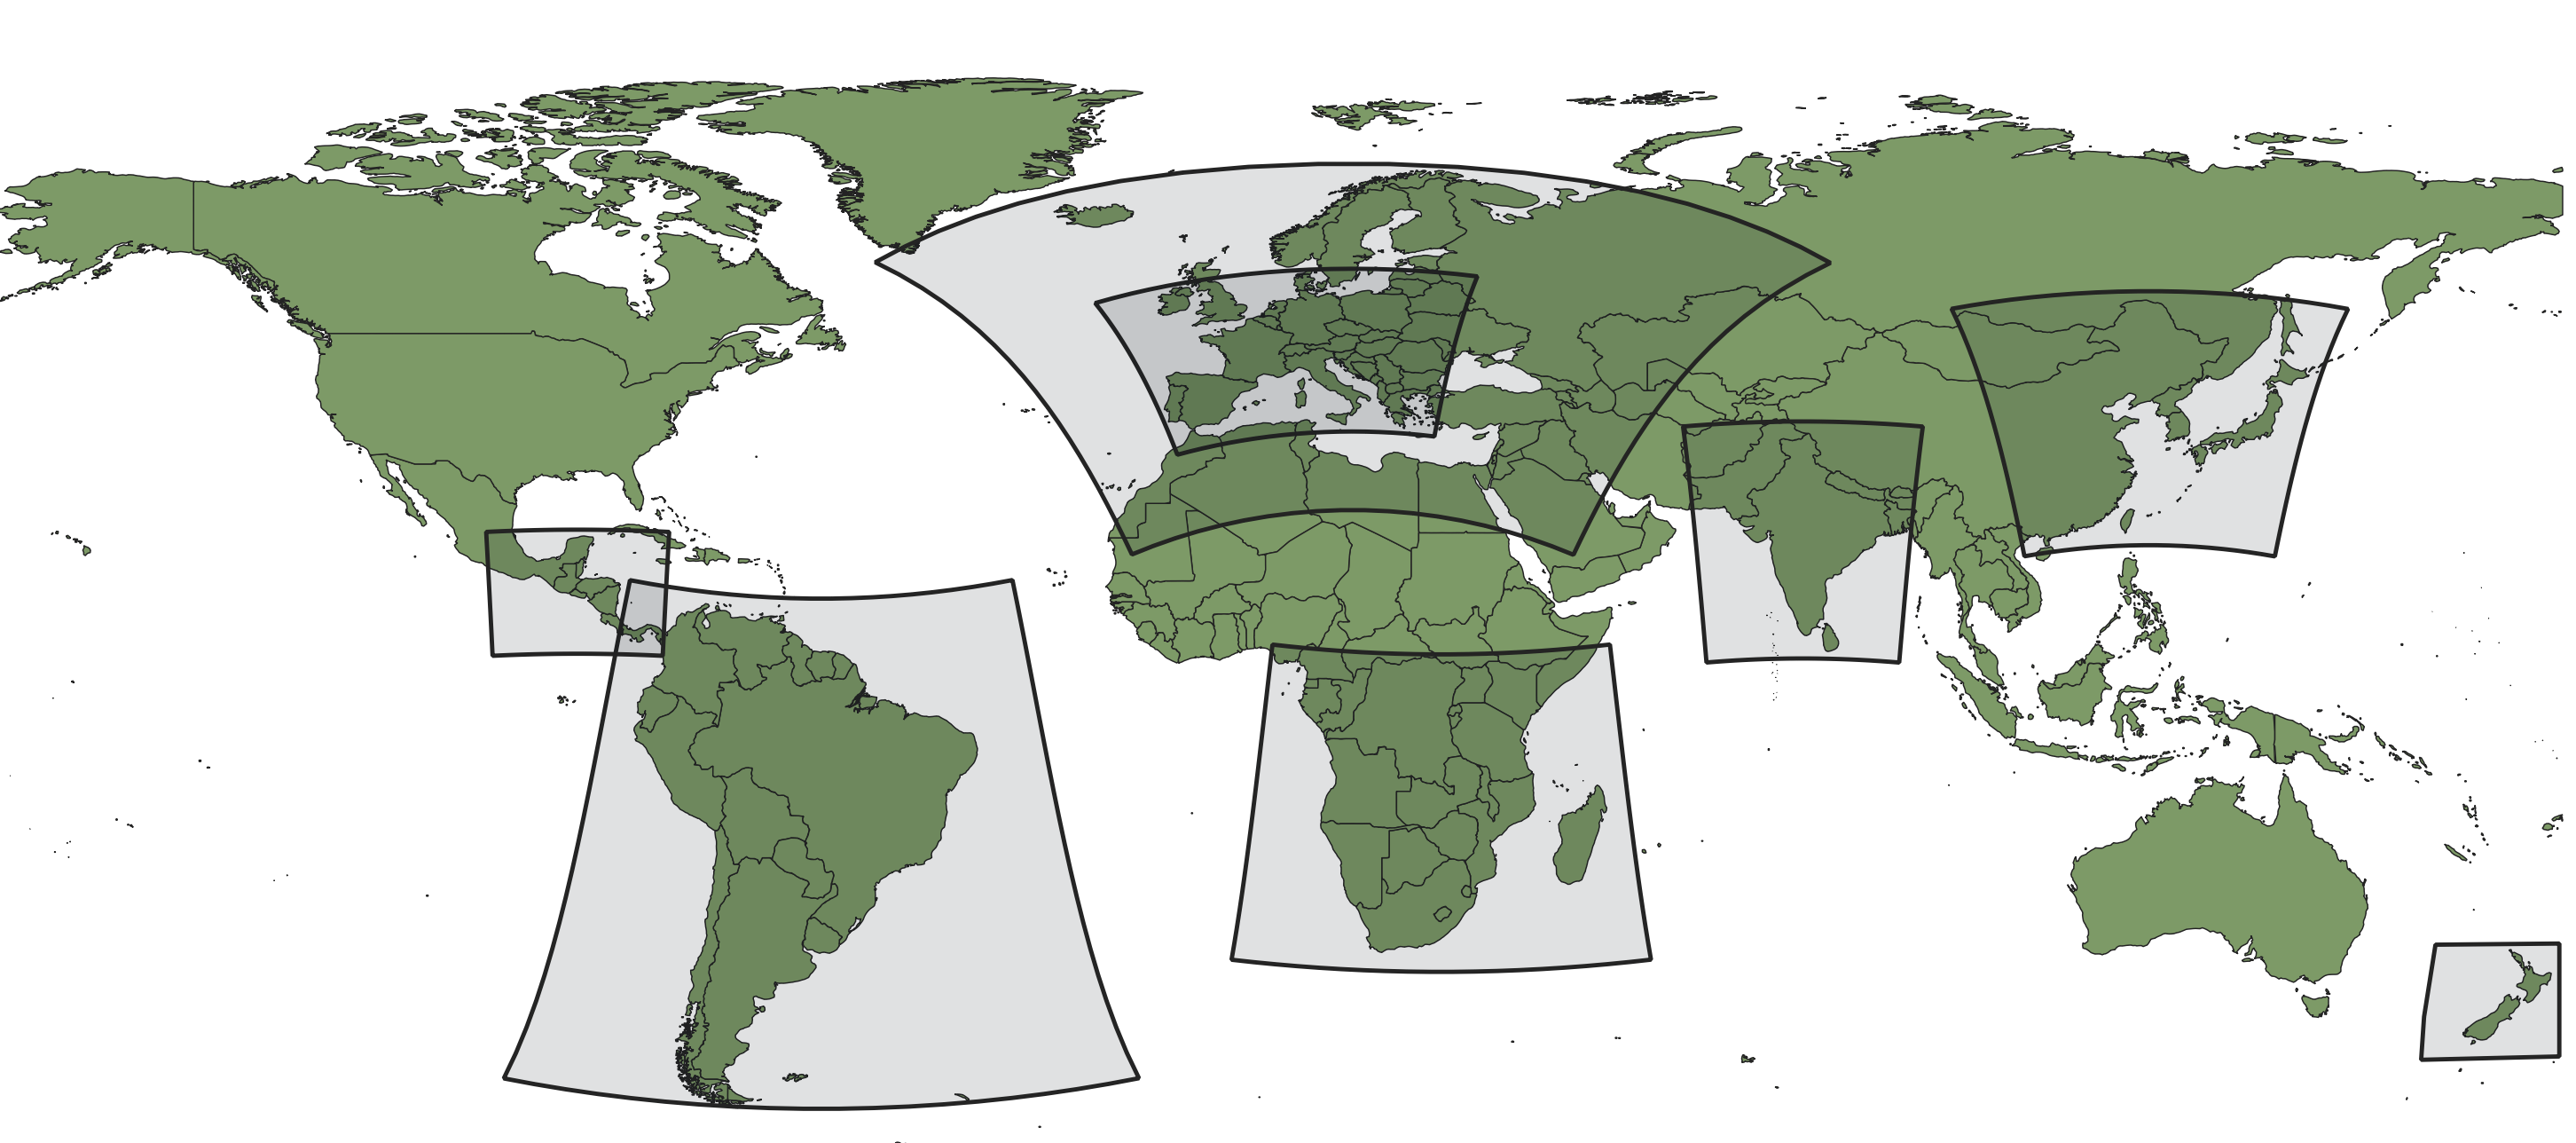
All weather variables are available for any place on Earth and at various different altitude levels, independent of measurement stations. We calculate global weather models as well as local high resolution models for Europe, North and South America, and most parts of Asia and Africa.
High precision
Intensive verification and validation improves our weather models beyond the quality and availability of historical weather measurement data. history+ combines convenience and unmatched accuracy to support your daily business decisions. The interface provides access to the proprietary global numerical weather model NEMS, the ERA5 re-analysis model, and to local high-resolution weather models for many areas.
Unlimited data downloads for 1 year
All data can be downloaded for the selected locations since 1940. Access remains active for 1 year after purchase and includes daily updates of the datasets.
100% complete without gaps
history+ offers 100% complete time series, with no missing data. All time series are consistent and gap-free, whereas measurements are often not available for the selected place, or unavailable for certain time periods or contain invalid data. Analysis with insufficient and inconsistent data makes results unreliable and massively increases the processing effort.
Multiple formats
Data can be interactively analysed on the web, and also downloaded as CSV files. Common evaluations such as year comparison, GDD calculation, frequency analysis, crop risk evaluations, or wind roses, are built-in. Downloaded CSV files can easily be imported into other professional applications.
Available right away
Easily download consistent historical data
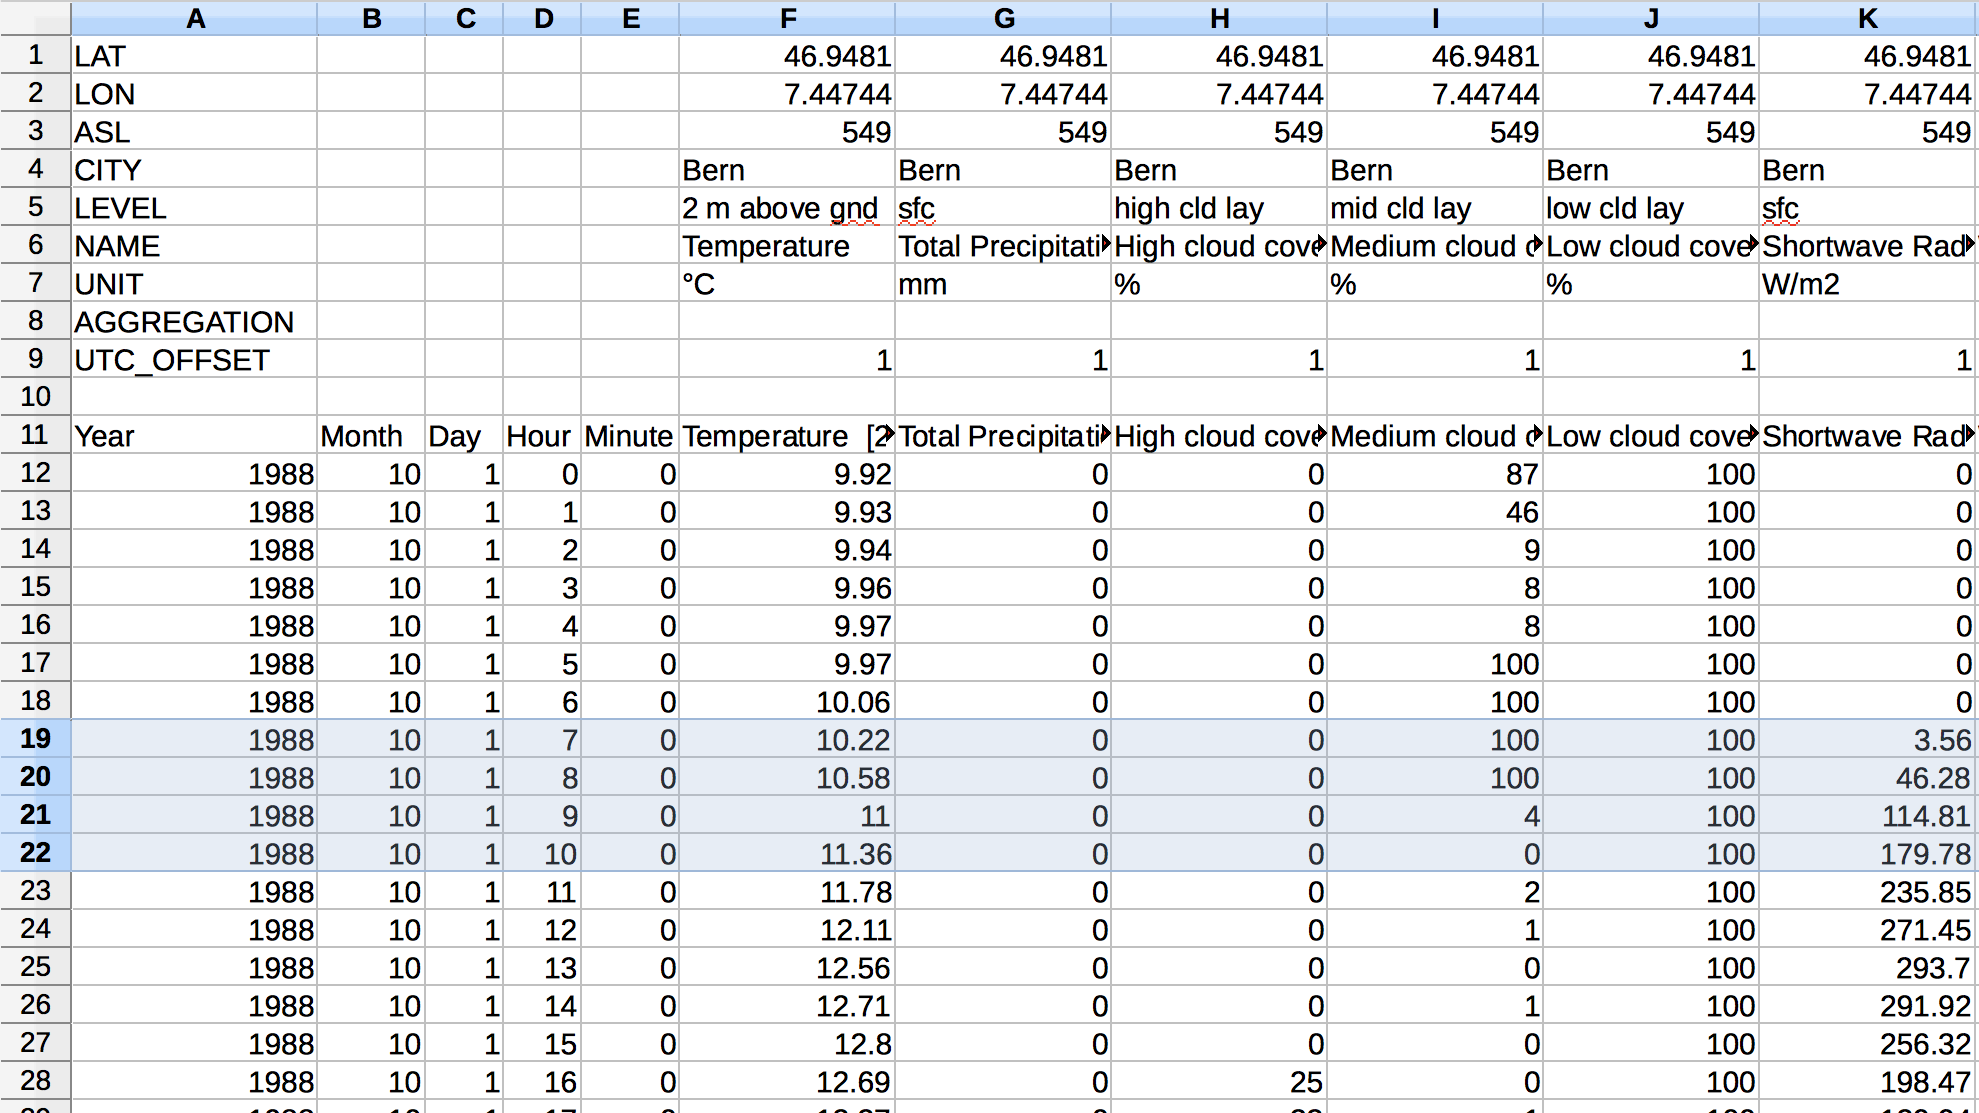
All data can be downloaded as CSV files and further processed with programs like Microsoft® Excel or OpenOffice. You can download entire time series since 1940 in hourly resolution with various parameters like temperature, precipitation, clouds or wind.
The data are available worldwide without any gaps and from different models. Our weather simulations are independent of single stations and possible outages.
Interactive interface to analyse data
Our database is packed with hundreds of TB of weather data and right at your disposition. Interactive graphs allow immediate access to continuous time series for your locations or various coordinates. You do not have to wait for a long-term weather data time series: It is there in a second.
You can compare multiple locations and detect weather differences that could impact or benefit your business. Gain valuable insights to prepare for typical weather conditions as well as for uncommon extremes.
Compare multiple years
Visualize several seasons with accumulated precipitation or growing degree days (GDD) in one graph. See how a wet or rather hot season may affect plant development, calculate a heating sum to predict how much energy is required during winters or estimate weather conditions for a single week to plan events.
All information and data are available immediately after purchase and can be displayed interactively in intuitive and interactive charts and diagrams.
Frequency analysis histogram and wind rose
In addition, history+ includes online analysis tools for frequency patterns and wind roses. Our tools are highly customizable to fit your specific needs and to save valuable time.
Wind speed frequencies for wind power generation are calculated for any coordinates on land or sea. Wind roses classify wind directions and speeds, e.g. to further evaluate potential wind park sites and improve power generation efficiency. Temperature and precipitation frequencies are visualised in a histogram and help to better understand business-threatening conditions such as frost or intense precipitation.
Risk Assessment
Analyse the probability of various weather-related risks like droughts, frost or strong wind occurrences. You can define your own thresholds to analyse the likelihood of the defined risk, the tolerable risk, and an analysis for each year since 1940. It is, thereby, a perfect tool to assist in weather-dependent decisions. Since certain weather conditions are more complex to model, it is essential to consider uncertainties by comparing weather models, such as the ERA5 dataset.
![Crop Risk Analysis: Cumulated GDD [˚C] and growth stages.](https://static.meteoblue.com/assets/images/products/historyplus/hplus_prod_page_risk_assessment.png)
![Crop Risk Analysis: Cumulated GDD [˚C] and growth stages.](https://static.meteoblue.com/assets/images/products/historyplus/hplus_prod_page_crop_climate_risk.png)
Crop climate risk analysis and prediction
The crop climate risk analysis diagram shows the risks of drought, heat, or frost for a selected crop at a selected location for a chosen period in the time from 1985 to today.
![Crop Risk Analysis: Cumulated GDD [˚C] and growth stages.](https://static.meteoblue.com/assets/images/products/historyplus/hplus_prod_page_crop_weather_risk.png)
Crop risk prediction monitors and evaluates crop risks based on the current season weather to date, the 7-day and the seasonal forecast. Historical reference periods can be included for comparison, such as a year with good or bad growing conditions. The crop climate risk analysis diagram supports operational decisions, e.g. when to plant, fertilise, or irrigate.
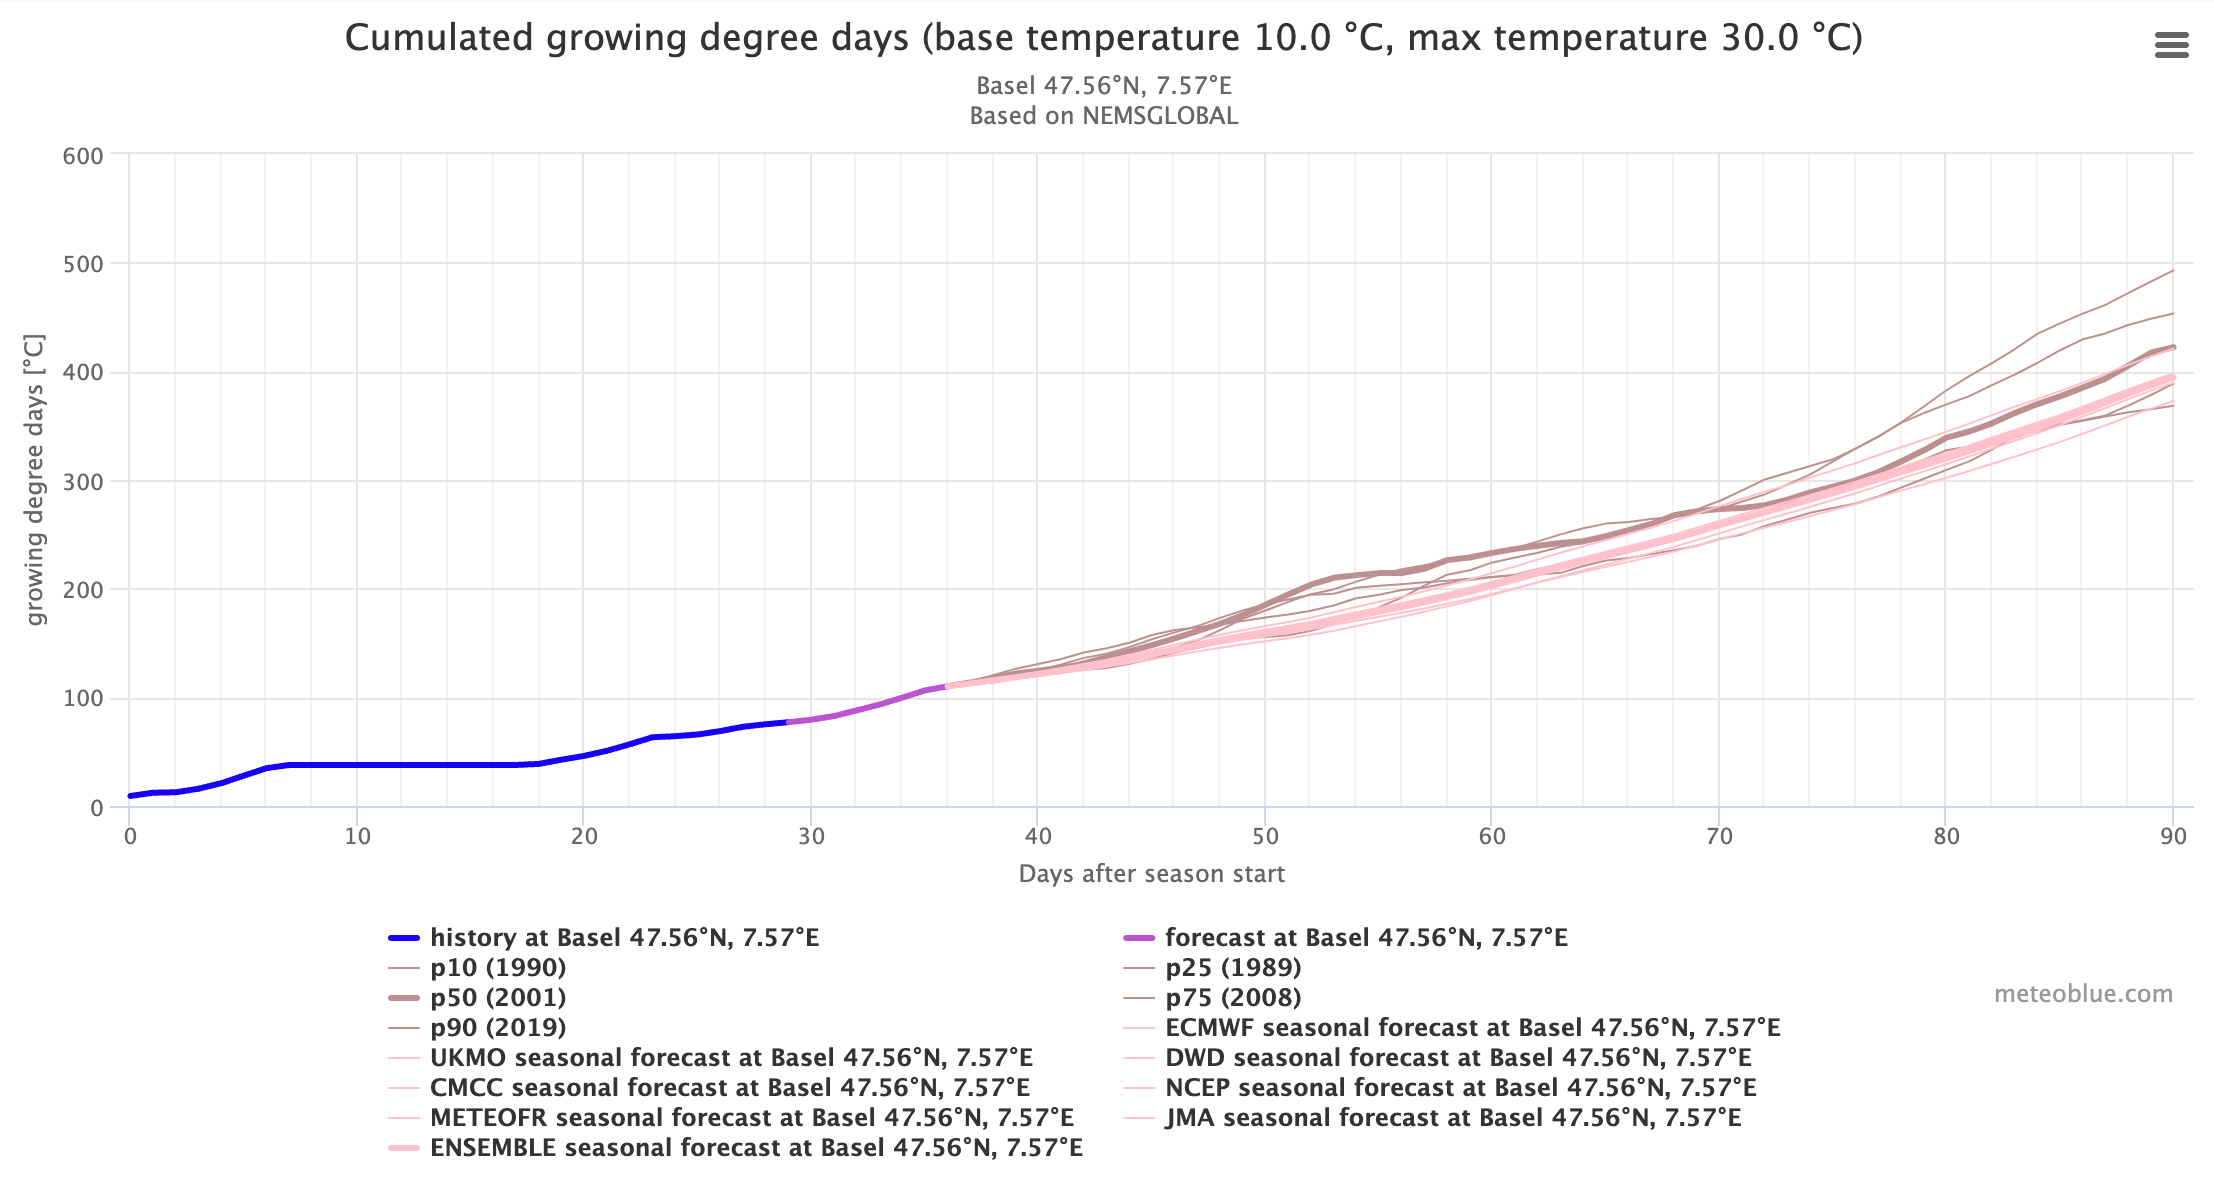
Accumulations
This tool combines past years with seasonal forecast data, providing a comprehensive view to investigate upcoming seasons, focusing on growing degree days (GDD), precipitation and evapotranspiration. This is particularly interesting for agronomical use cases to analyse and plan crop seasons.
Included weather variables
Temperature
2 m above ground
Relative humidity
2 m above ground
Pressure
at sea level
Precipitation amount
mm/m2
Snowfall amount
cm/m2
Total cloud cover
in percent
Solar radiation
W/m2
Wind gust
10 m above ground
Wind speed and direction (10 m)
km/h, m/s, bft, kn, mph
Wind speed and direction (80 m)
km/h, m/s, bft, kn, mph
Wind speed and direction (900 hPa)
km/h, m/s, bft, kn, mph
Low, mid, high cloud cover
in percent
history+ includes the most common weather variables as well as specialised parameters. Other variables are available on request.
Try for free
You can test history+ without a subscription and explore the endless possibilities of historical weather data. The free test is limited to Basel, Switzerland.
Prices and Order
How many locations do you need? At the moment of purchase, you receive access to selected number of locations, without having to decide which ones. Your desired locations or coordinates can be activated afterwards in the data download interface. history+ access remains active for 1 year, starting at the purchase date. You can buy more locations at any later time as well. High-volume discounts for more than 10 locations are available on demand.
0% VAT included in all prices
Data since 1940
Optional automatic renewal
Available for one year
One-time payment
Data since 1940
Optional automatic renewal
Available for one year
One-time payment
Data since 1940
Optional automatic renewal
Available for one year
One-time payment
Data since 1940
Optional automatic renewal
Available for one year
One-time payment
VAT & Pricing
VAT will be deducted for EU business customers with a valid VATIN. The identification number is required and will be automatically validated against the EU database before purchase. All services are associated with your meteoblue account, which will be created in the ordering process. Upon payment confirmation, you receive an invoice as PDF with the indicated VAT amount. Invoices can also be downloaded from your meteoblue account overview.
The payment is handled by Datatrans, a PCI-DSS certified payment service provider for more security in payment transactions. Your credit card information is transmitted using data encryption, only used for one transaction and not stored. The security of your data is very important for us. Payment options include Paypal, Visa, Mastercard and Swiss Postfinance.
About simulation data
What you get
history+ offers historical weather simulation data, with a spatial resolution between 4 and 30 km, not measurement data. Starting in 1940, the historical weather data are available in hourly steps or daily aggregations with a spatial resolution of 30 km, whereas higher resolution data are available since 2008 for nearly every place on Earth. These data are 100%% complete, without any gaps. Our worldwide data availability and completeness are unique.
Extensive verifications of our weather models are regularly conducted and thereby, top data quality is ensured.
Simulation data are especially suitable for assessing weather for areas and regions over longer time periods, whereas measurement data are used to record specific local conditions or extreme weather events. Therefore, not all insurances accept weather simulation data as evidence.
Limitations
Resolution: The data have a spatial resolution of 4 to 30 km, depending on location and period (see map below). Local micro-climates, e.g. in narrow valleys or on mountain tops, cannot be captured accurately, and between 1940 and 1980, data accuracy might be lower due to the absence of satellite observations in this period. However, even for those locations and time periods, you can easily analyse trends over the years, seasons, months, weeks, or even day-to-day changes, always taking into account that there may be biases in the absolute values.
Extreme events: If you want to know if on the 22nd of February 1992, there was a local thunderstorm with 100 mm of rain and winds over 80 km/h, unfortunately this will not be possible. Simulation data cannot capture the exact timing and intensities of isolated extreme weather events. For this, you would need to find a weather station, but it would have to be at the exact spot, not several kilometres away, which is rarely possible. For such requests, please feel free to contact [email protected].