The reports have been prepared with due diligence and in alignment with applicable standards, and are intended to support a successful audit outcome. While they provide a solid foundation for the audit process, the final assessment remains at the discretion of the auditors and may be influenced by additional factors beyond the scope of the reports.
Instant access to physical
Climate Risk Assessment
Receive your Climate Risk Reports within minutes – to support compliance with the EU taxonomy, CSRD, or ESRS requirements.
Trusted partnerships in the sustainability sector


Dr. Gereon Klein
Senior Consultant

The climate risk analysis of meteoblue serves the geo-physical dimensions of the EU taxonomy in a scientifically sound, spatially high-resolution and detailed way for the climate-relevant variables.
Major auditing firms have meanwhile audited and certified meteoblue climate risk analysis procedure. It is a great advantage for our clients to be able to reliably serve these aspects of regulatory and non-financial reporting with a standard process.
Climate Risk Report – Supporting Sustainability Reporting
The Climate Risk Report enables a site-specific climate risk assessment, covering 28 types of climate hazards and offering risk classifications based on the latest climate science and modelling best practices. It provides decision-ready insights into physical climate risks, supporting ESG reporting.
The report is designed to support alignment with frameworks such as the Corporate Sustainability Reporting Directive (CSRD), the European Sustainability Reporting Standards (ESRS), and the EU taxonomy.
Deliverables
- 30-page Climate Risk Report (PDF) - site-specific analysis
- 50-page Technical Documentation (PDF) – detailed methods and data sources
How to get your Climate Risk Report
01
02
03
Choose your location package
Choose the number of locations for your business and take advantage of our attractive volume discounts.
Log in or register
Log into your meteoblue account or register within 30 seconds. Pay via credit card or PayPal.
Access your Climate Risk Reports
Input your coordinates and access your location-specific Climate Risk Report instantly.
Fulfil requirements of international frameworks
To ensure compliance with international regulatory frameworks, meteoblue closely collaborates with experienced partners and continuously aligns its services with the latest standards.
Secure your assets and investments
Implement targeted adaptation measures based on state-of-the-art data.
Safeguard your business model
Identify and manage climate risks to your operations and value chain. Our data-driven analyses support long-term business resilience.
Download a Climate Risk Report for the location of Basel
A sample report for Basel is available for download - consistent climate data can be generated for any location globally, providing the essential comparability.
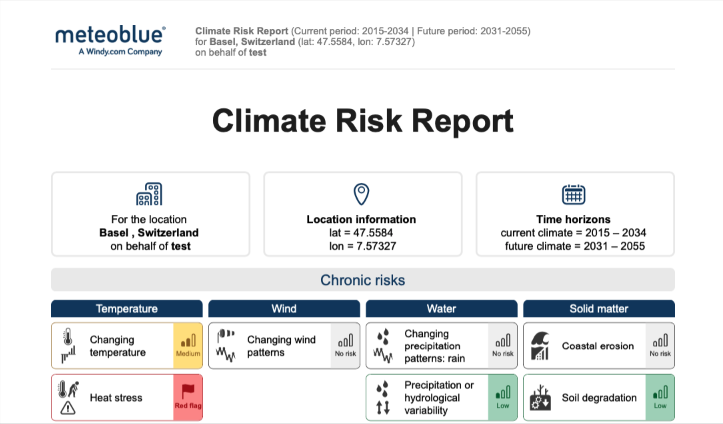

Risk Classification
The Climate Risk Report classifies 28 risks into five classes, reliably indicating if action is required.
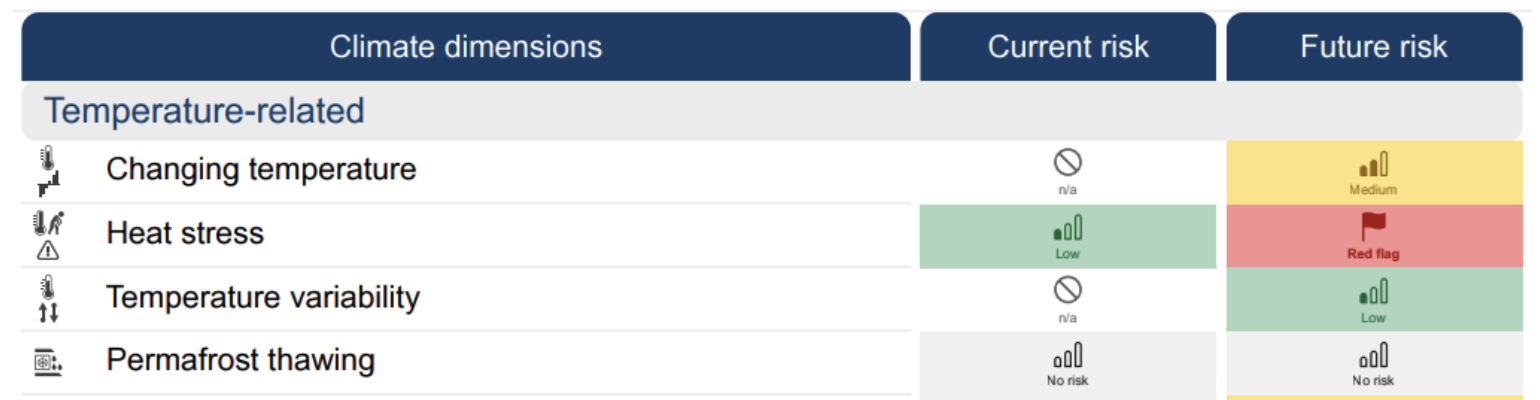
Current and Future Risk
The Climate Risk Report visualises current and projected climate risks, offering a clear understanding of potential future increases.
Order your Climate Risk Report now
0% VAT included in all prices
1 location
120.00
€
Product designed for regulatory compliance
28 climate dimensions
4 SSP scenarios
One report for each location
Top Seller
3 locations
300.00
€
Product designed for regulatory compliance
28 climate dimensions
4 SSP scenarios
One report for each location
10 locations
690.00
€
Product designed for regulatory compliance
28 climate dimensions
4 SSP scenarios
One report for each location
Customised solution
Custom
Access to climate data & custom visuals
Seasonal analysis
Still not convinced and want to talk to an expert?
Comprehensive Climate Risk Assessment by meteoblue and reliable partners

Hazard
A potentially damaging event or trend related to climate or weather.

Exposure
The presence of people, assets, or ecosystems in areas that could be affected by climate-related hazards.

Vulnerability
The degree to which people, assets or ecosystems may be harmed due to their inability to cope or adapt.
Transitional risk; financial impact and opportunities for ESG reporting

Maik Richter
Member of the sustainability team

We at ENTEGA are extremely satisfied with the simple provision of climate data by meteoblue. The quality and accessibility of the data have made our work in the sustainability team much easier.
I would particularly like to emphasise the commendable service: we always receive detailed and helpful answers to our queries. We can recommend meteoblue to anyone who needs reliable climate data.
Frequently Asked Questions
The regulatory framework defines the key data for climate risk analysis, which meteoblue adheres to, including four SSP scenarios and 28 climate hazards. Additionally, meteoblue strictly follows the guidelines of the German Federal Environment Agency for climate risk assessments..
meteoblue utilises state-of-the-art technology, quality-controlled datasets, and its own downscaling to 12 km to enhance reliability. However, these are climate projections—predictions extending into the distant future—so a certain degree of uncertainty remains. To address this, meteoblue provides detailed information in the technical documentation outlining the uncertainty of each climate hazard.
