
News
meteoblue Christmas Party 2025: A Festive Evening of Reflection and Togetherness
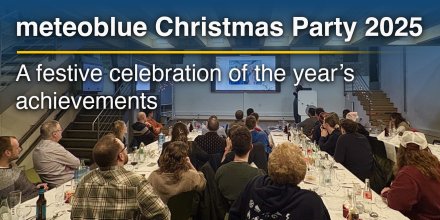
As December marked the final weeks of another busy year, it was time for one of our most valued traditions: the annual Christmas party. On the 11th of December, colleagues from across the company came together to celebrate the year's achievements, enjoy good food, and share a relaxed evening together – this time in a new and memorable setting.
Read on


 Binga
Binga 


