
point+
Ulteriori opzioni per questo meteogramma sono disponibili con point+
Per saperne di più

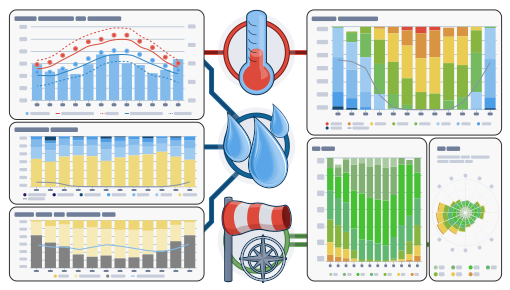
L'archivio meteo dà accesso alle simulazioni meteorologiche del passato per ogni luogo del mondo. È possibile vedere informazioni meteorologiche per la giornata di ieri o lo storico degli ultimi anni. I diagrammi dell'archivio meteo sono suddivisi in 3 grafici:
- Temperatura, inclusa l'umidità relativa a intervalli orari
- Nuvole (fondo grigio) e cielo sereno (fondo azzurro). Più scuro è lo sfondo grigio, più densa è la copertura nuvolosa
- Velocità e direzione del vento (in gradi 0° = Nord, 90° = Est, 180° = Sud e 270° = Ovest). Nel meteogramma dell'archivio meteo, la linea verde rappresenta la velocità del vento e la rosa dei venti la direzione del vento.
Please consider the following:
- The weather archive shows simulation data, not measured data, for the selected area.
- The data is not compared to measured data of a weather station (because in more than 99% of the places on Earth, no measurements are available). Simulation data with high predictability can replace measurements. For areas or data with lower predictability, simulation cannot replace measurements and can also not be used as an evidence.
- Wind and temperature data are calculated with the average altitude of the grid cell. Therefore, the temperatures for mountains and coasts can be a somewhat different from the data at the exact location which you have selected. You can find the altitude of the grid cell besides the coordinates.
- The "15-day" diagram shows hourly data. For one month, there are daily aggregations for minimum, maximum and average values. For more than 6 months there are monthly aggregations.
- We also offer raw data for sale. Please contact us for more information ([email protected])
I dati meteorologici storici orari dal 1940 per 30.07°N 58.84°E possono essere acquistati con history+. Scaricate variabili come temperatura, vento, nuvole e precipitazioni come CSV per qualsiasi luogo della Terra.