
point+
Weitere Optionen für dieses Meteogramm sind mit point+ verfügbar
Mehr erfahren

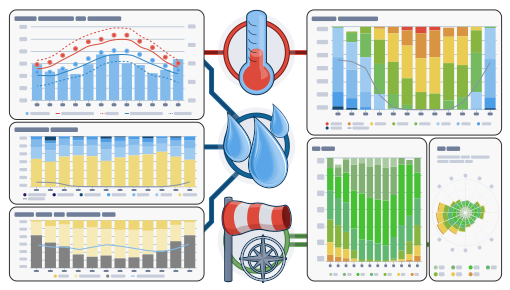
Das Wetterarchiv bietet Zugang zu vergangenen Wettersimulationen für jeden Ort der Welt. Sie können auf Wetterinformationen für gestern oder die Wetterhistorie der letzten Jahre zugreifen. Die Diagramme des Wetterarchivs sind in 3 Grafiken unterteilt:
- Temperatur, einschließlich relativer Luftfeuchtigkeit in stündlichen Intervallen
- Wolken (grauer Hintergrund) und klarer Himmel (hellblauer Hintergrund). Je dunkler der graue Hintergrund ist, desto dichter ist die Wolkendecke
- Windgeschwindigkeit und -richtung (in Grad 0° = Norden, 90° = Osten, 180° = Süden und 270° = Westen). Die grüne Linie stellt die Windgeschwindigkeit und die Windrose die Windrichtung dar.
Please consider the following:
- The weather archive shows simulation data, not measured data, for the selected area.
- The data is not compared to measured data of a weather station (because in more than 99% of the places on Earth, no measurements are available). Simulation data with high predictability can replace measurements. For areas or data with lower predictability, simulation cannot replace measurements and can also not be used as an evidence.
- Wind and temperature data are calculated with the average altitude of the grid cell. Therefore, the temperatures for mountains and coasts can be a somewhat different from the data at the exact location which you have selected. You can find the altitude of the grid cell besides the coordinates.
- The "15-day" diagram shows hourly data. For one month, there are daily aggregations for minimum, maximum and average values. For more than 6 months there are monthly aggregations.
- We also offer raw data for sale. Please contact us for more information ([email protected])
Stündliche historische Wetterdaten seit 1940 für Collison Range können mit history+ erworben werden. Laden Sie Variablen wie Temperatur, Wind, Wolken und Niederschlag als CSV für jeden Ort der Erde herunter.