
Stefan Zeberli is an experienced Swiss professional balloon pilot and leader of the ballon world ranking since 2019. For the crossing of Kilimanjaro by the hot air balloon, the teams used meteoblue weather data and services for planning. After the expedition, Stefan shared his insights into his unique balloon expedition, incredible pictures and the importance of weather information.
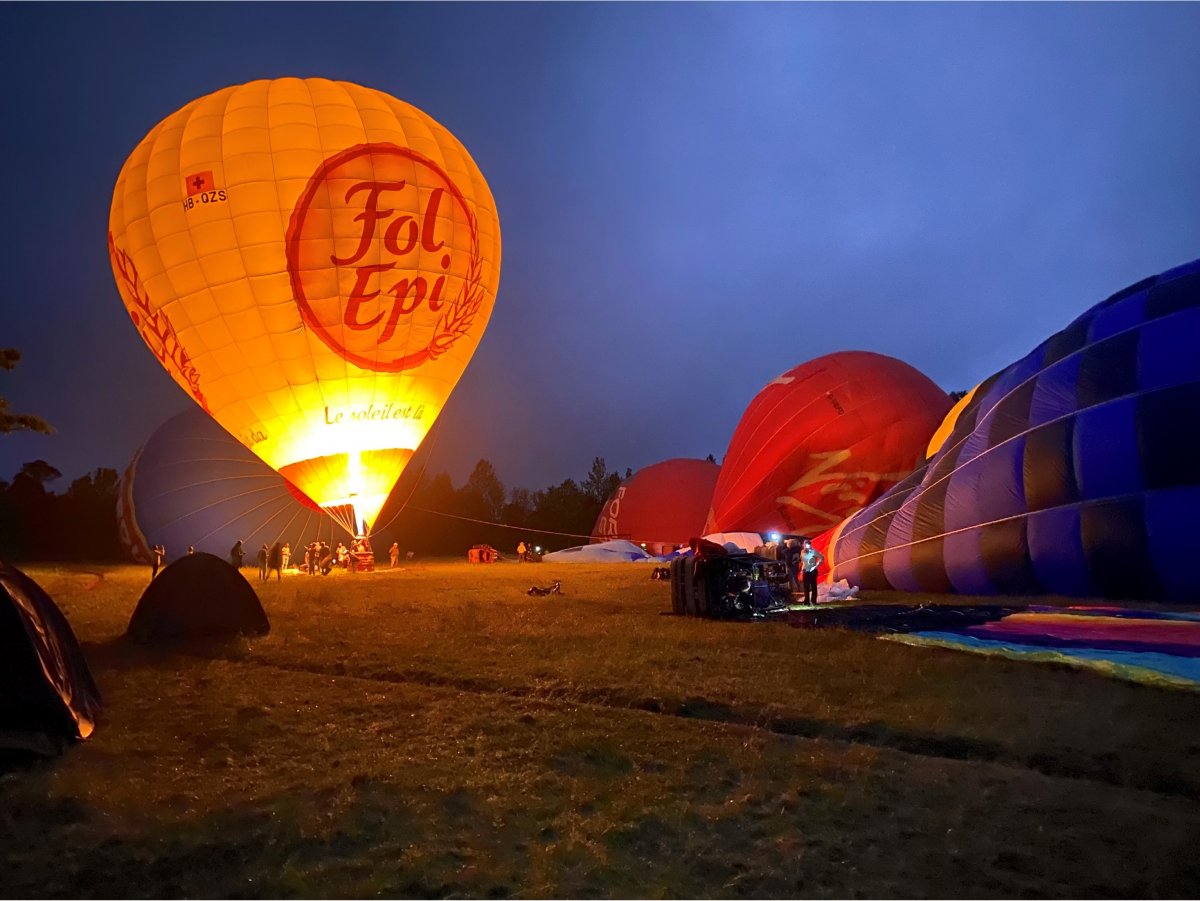
Transporting 15 hot air balloons, equipment and almost 100 crew members from overseas to Kilimanjaro required major logistics: several truckloads, hundreds of permits, and time. The project's first challenge was then to find the right timing for the expedition: a month with less cloudiness and precipitation, suitable wind conditions and limited risk of unforeseen events. Therefore, our historical weather data base was used. The weather archive summarizes the overall weather conditions of the past years. This analysis was essential to avoid overly rainy or windy seasons, and to detect seasonal and daily weather patterns and anomalies. The weather data included in history+ provided detailed information on clouds, precipitation, as well as wind speed and direction in different altitudes, necessary to determine the frequency of 15 - 20 knots of wind speed in the higher-flying altitudes, needed for crossing the summit with available fuel. With this information, the expedition was planned for December 2021, and the entire logistics chain was set into motion.
The second challenge was to define the best location for the start of the balloon ride. It had to be on the windward side of the mountain, close to the foothills and to a road with sufficient open space for setting up 15 hot air balloons, yet out of reach of potential catabatic (downhill) winds, which can be expected at the bottom of large mountain ranges. With the help of the history+ wind rose, different weather models and local measurements, the range of possible starting locations was narrowed to a few square kilometres and refined with the weekly weather forecasts. This enabled the ground crew to localise a suitable starting place for the expedition and prepare it for the arrival of 15 hot air balloons and their equipment.


The meteorology team then had to determine the optimal starting day and time, constantly checking the weather forecast for the following days, using a range of special functions:


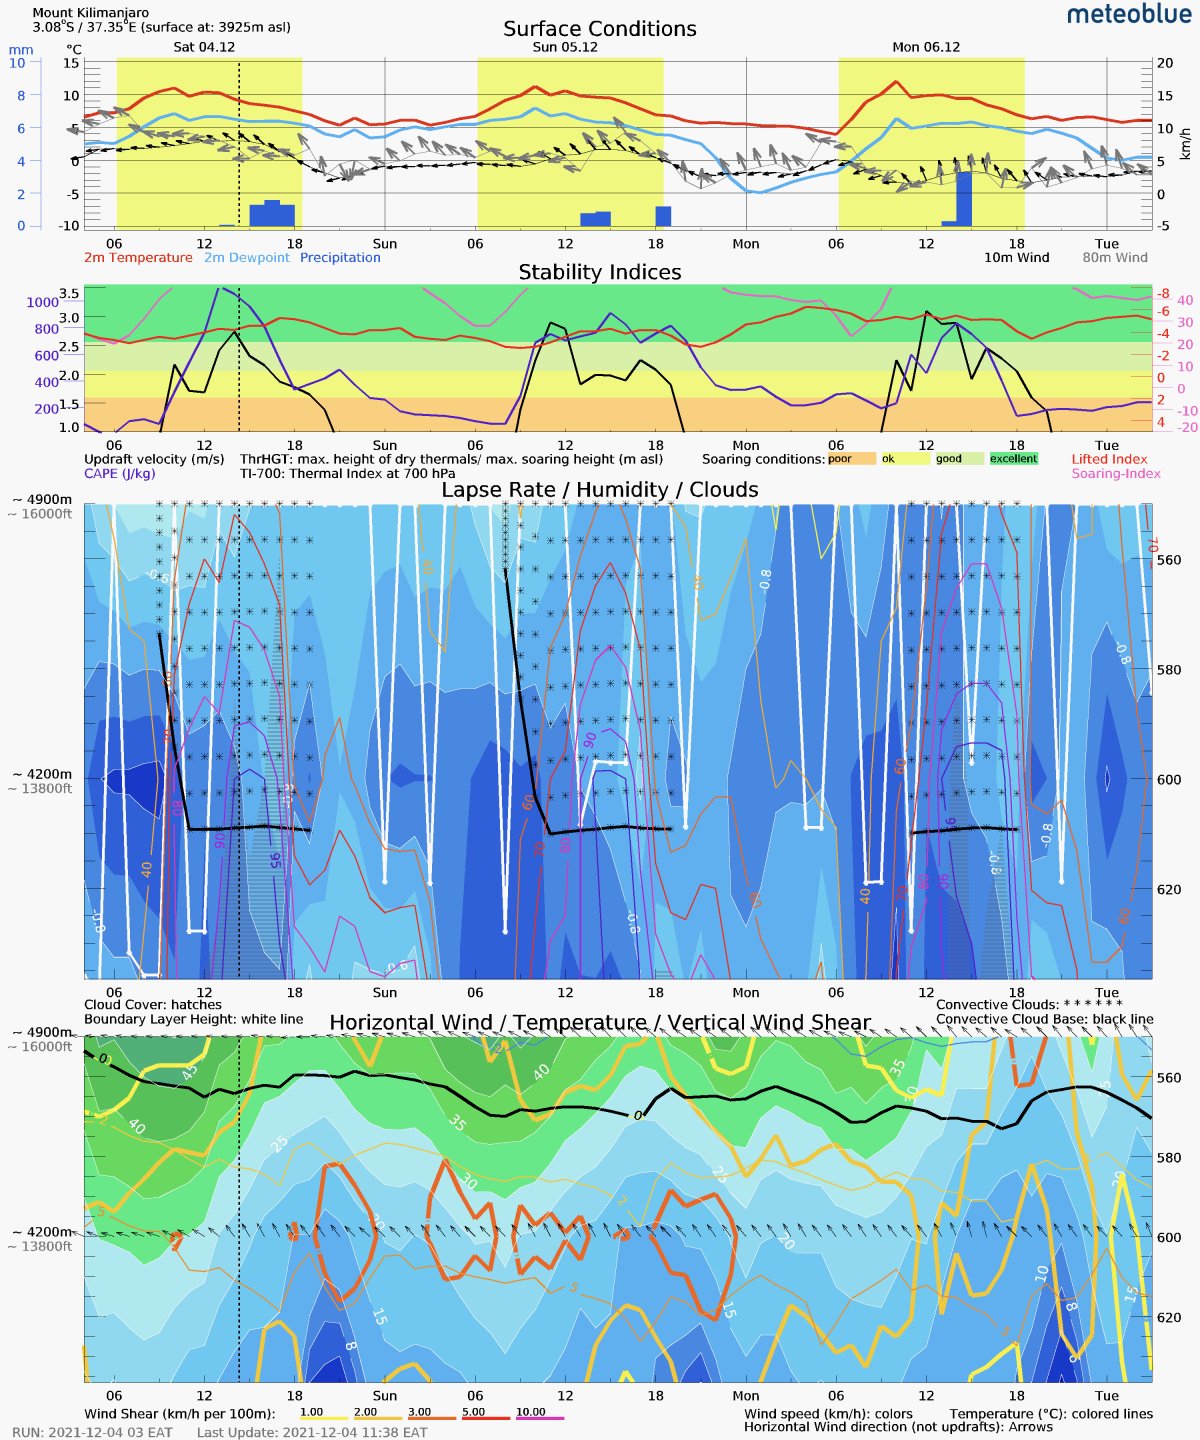


- Meteogram: This simple yet highly detailed chart shows the suitable time windows for the flight, both for starting and landing.
- Wind animation: The wind animation shows the wind at different altitudes and is used to analyse surface wind conditions for starting and landing and higher altitude winds.
- Thermal forecast: Increasing thermal activity hampers ballooning, and the meteograms show the lower risk periods - in this case, the morning hours - in just one diagram.
- Sounding: The sounding diagram shows weather developments from ground to stratosphere level, which gives the best view of changing cloud, temperature and wind conditions in different altitudes.
- Trajectories: These show a flight path based on air movements from the starting to the landing location for different heights.
Most of these functions were specially designed for aviation purposes and are included in our point+ subscription, which you can test without any obligations for 14 days.
The expedition started early in the morning of 6 December, setting up the balloons under some nighttime drizzle, too local to be picked up by satellite radar. After the drizzle subsided, the Lift-off started during dawn. Balloon pilots had to avoid the remaining cumulus clouds, quickly gain altitude and panoramic views and find the needed westerly winds. With the rising sun, the winds increased, remaining clouds dissipated soon and gave way to stunning views of the majestic summit and surroundings.

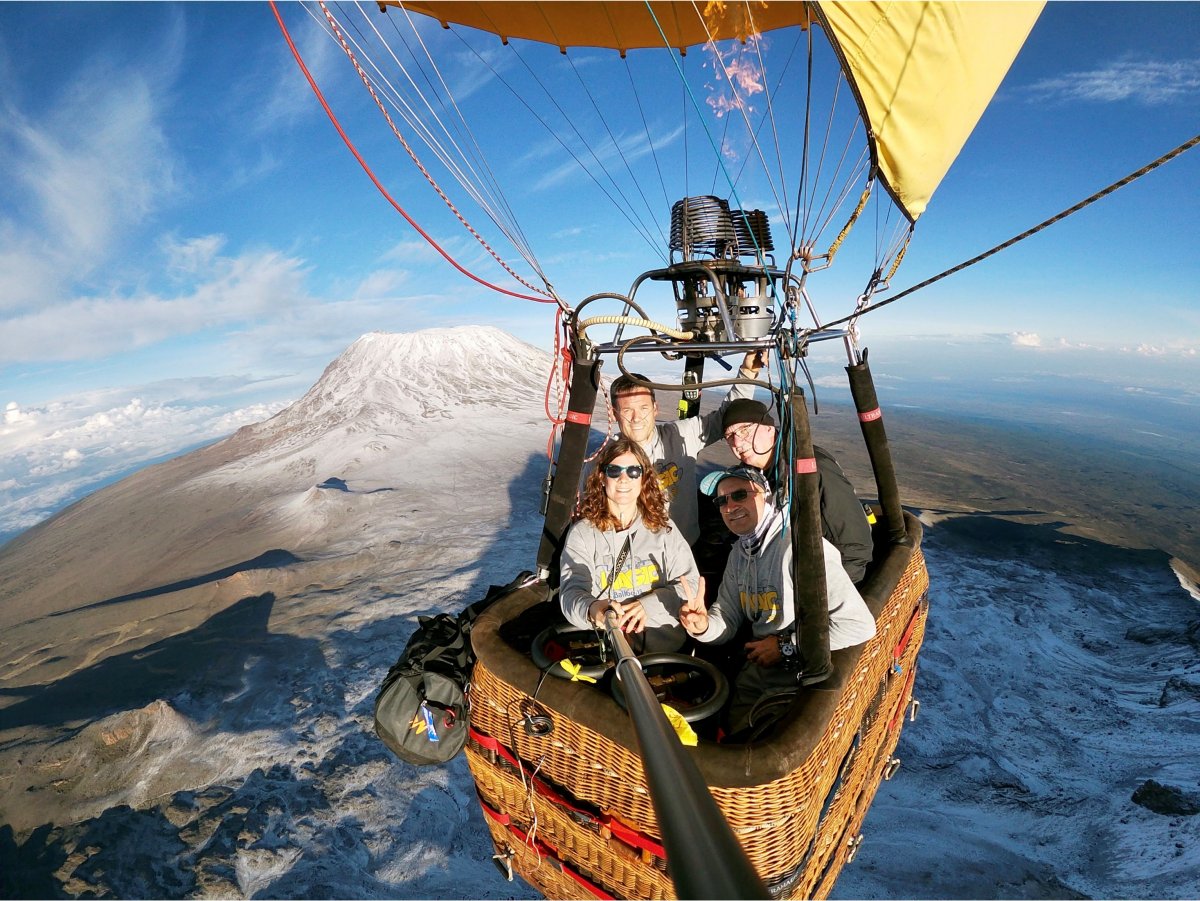


The landing was more than a reward - it was a celebration.

Based on the Expedition experience, we have now enabled our Stueve and Sounding for MultiModel selection, so pilots can better study the most local (or most representative) weather models for any place on Earth.
We are very grateful to see our weather data is used, for the learnings from such experiences and would appreciate any feedback on how you are using our data.
